

By clicking the “I Accept” button, or by accessing, participating, or submitting any information, or using the Jabil Global Intelligence Portal or any of its associated software, you warrant that you are duly authorized to accept the Global Intelligence Portal Terms and Conditions on behalf of your Company, intending to be legally bound hereby, and your company shall be bound by the terms and provisions of the Global Intelligence Portal Terms and Conditions, accessible under the following link Portal T&Cs.
Jabil's Global Category Intelligence Archive
Global Category Intelligence
Q4 2022
Jabil's Global Category Intelligence Archive
Global Category Intelligence
Q4 2022
ASIA
Market Overview
- The landscape remains unchanged with COVID-19 continuing to cause transportation challenges throughout the region.
- Recent pandemic-related restrictions are targeted, relieving some logistical constraints and allowing major gateways to remain operational.
- Capacity in China’s major gateways has resumed following the end of the Shanghai lockdown.
- Tightness at ocean ports continues through this quarter, including at key trans-shipment ports in Asia.
- Equipment supply remains stretched, and the shortage of empty containers is also persisting.
- Whilst global reliability has improved, it continues to remain extremely low at 40.5%, with specific lanes performing lower.
- It remains our recommendation that a 2-week short haul and 4 to 5 weeks long haul lead-time extension be included in forecasts.
- To ensure continuity of service, it remains necessary to provide a 4-week rolling forecast for both Air & Ocean freight.
- To do so, a booking must be placed at least 1 week in advance for air mode and at least 4 weeks for ocean.
- Courier freight restrictions, particularly in Eastern China, have been lifted and operations have returned to normal.
- Ground transportation has been improving, especially at the Chinese, Hong Kong, and South Asian borders.
- However, a resurgence of COVID infections in Hong Kong has impacted cross-border trucking, resulting in curtailment of capacity by up to 60%.
Air Freight – Demand Commentary
- Compared with 2019, global air cargo demand fell for the 5th month in a row in July as the industry continues to face disruptions. This follows a drop of 8% in June and May’s 7% decline.
- In July, air cargo demand dropped by 9% year-on-year, and the dynamic load factor – considering both weight and space – slipped 8 percentage points from last year to 58%.
- World ACD outlined that aircraft payloads fell 9% during the second half of June in comparison with last year.
- The third quarter is typically the second-slowest air freight shipping season, and we are currently entering the normal late-summer lull before the onset of the holiday peak.
- Another possible explanation is that the post-shutdown manufacturing ramp in China has been more gradual anticipated.
- Chinese manufacturing is ramping up gradually, possibly due in part to conservative ordering as consumers spend again on services and limit other purchases because of inflation.
- Although manufacturing PMI in China recovered in May, it was still below trend and in contraction territory.
- There is also a suggestion that demand is starting to moderate on a longer-term basis.
Air Freight – Supply Commentary
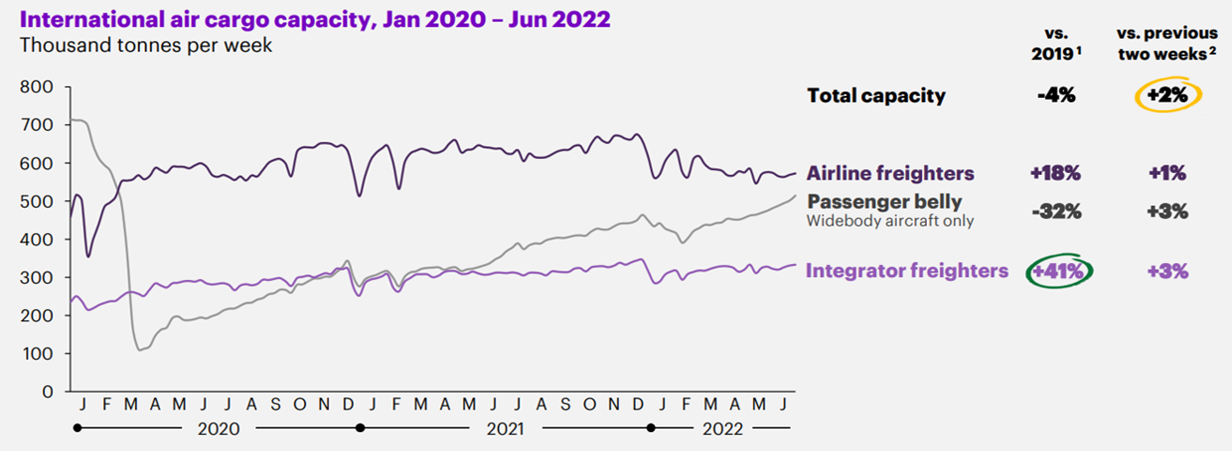
- Global air capacity was down by 5% in Jul 2022 when compared with Jul 2019 and remains below pre-pandemic levels.
- Belly capacity remains at 31% below pre-COVID levels.
- Monthly capacity recovery has tempered due to service disruptions and recurring backlogs.
- Amongst the major trade lanes, ASPA outbound capacity remained constrained due to the cancellation of flights traveling to Europe and North America.
- The closure of airspace due to geopolitical conflicts and tensions continues to constrain capacity.
- Order deferrals, pre-freighters back to passenger conversion, freighter retirement, and backlogs are adding to concerns over the pace of industrial recovery.
- A 2.7% increase in capacity - including 5.7% more space on critical international long-haul flights - supported the transportation of more goods, however, businesses continue to experience difficulty securing fast uplifts as cargo capacity remains 12% below 2019 levels.
- A significant portion of increased transport supply comes from the sustained reintroduction of passenger flights for the summer travel season.
- According to IATA, passenger demand in May increased by 83% from last year and international capacity reached 64% of 2019 levels.
- The war in Ukraine has, however, reclaimed some of the additional capacity following Western sanctions removing Russian all-cargo carriers from circulation.
- As a result, Volga-Dnepr - an operator of ultra-large cargo jets - is now severely restricted in the number of countries it can operate within.
Air Freight - Pricing Situation
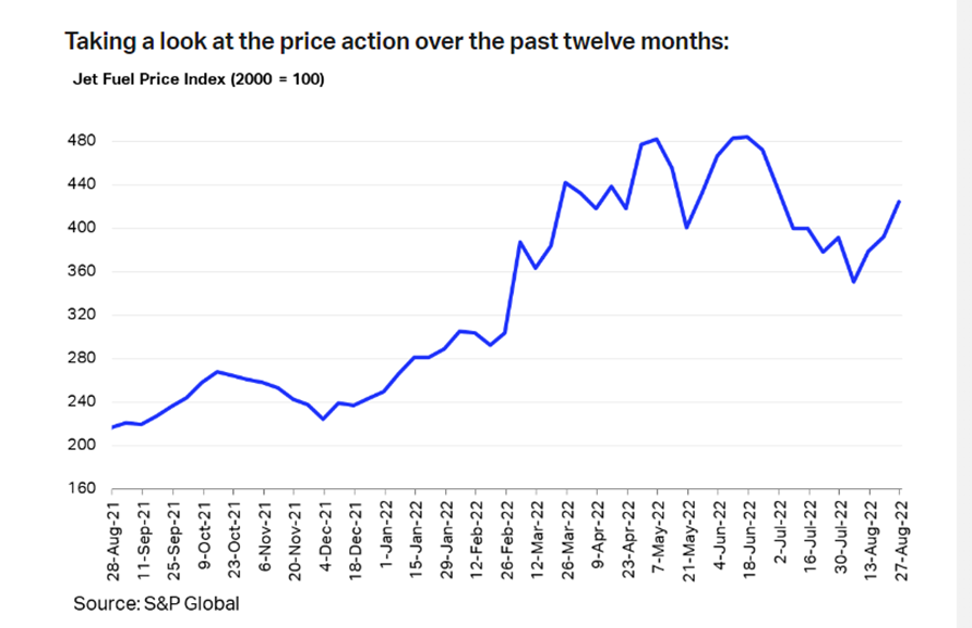
- In July, Jet fuel price reached $143 per barrel; whilst crude oil averaged over $100 per barrel.
- The Russian invasion of Ukraine continued to cause supply disruptions through the previous quarter and the situation looks unlikely to de-escalate in the short to medium term.
- EIA still estimates that oil prices will be <$100/Bbl in 2023; any price forecast is highly uncertain though as oil inventories may increase.
- Global liquid fuel consumption increased year-on-year and the EIA forecasts that average global consumption will increase further in 2023.
- Rates are showing signs of softening on a few trade lanes; however, it remains at 121% higher than July 2019 and 20% higher year on year.
- With softened demand and some capacity recovering, we are likely to see an aggressive spot market on certain trade lanes.
- Rates are still likely to remain affected due to high jet fuel prices and service disruptions.
- Fuel surcharges however are likely to decrease as the price of oil eases after recent highs.
- Airspace closures and canceled or re-routed flights may lead to higher transit and increased costs conversely putting upward pressure on the rates.
Key Takeaways - Air Freight
- The volume of global air shipments has declined through the past two months in line with slower economic growth and seasonal patterns.
- A surprisingly muted recovery of Chinese manufacturing post-lockdown has dampened potential rate increases.
- More recent indicators, however, suggest the slack period could end soon.
- Although weaker volumes combined with a gradual recovery in international passenger belly capacity put downward pressure on prices in June, air transport is still significantly more expensive than pre-pandemic.
- Air freight rates have been relatively stable. Average cargo rates worldwide remained flat in August and are almost 20% higher than this time last year.
- The higher rates can be attributed to the persistent shortage of available widebody airliners that were experienced through the COVID crisis.
- Air cargo volumes have now dropped for 4 consecutive months after huge gains in 2021 relative to 2020 and pre-pandemic levels.
- Summer is typically a slow period for international shipping, which picks up in the 3rd quarter as retailers move orders for the school and holiday shopping seasons.
- IATA last month forecast airlines would carry record tonnage in 2022, aided by a strong second half. Revenues are expected to taper off with lower yields but remain twice the value achieved in 2019.
- However, the war in Ukraine remains a problem, as do heightened tensions in Taiwan.
- Geo-political conflicts add to the variety of problems in the air market and dampen the reduction of freight rates globally.
- Intra-Asia and India Sub-Continent outlook remains unchanged with a reliance on belly freight that will continue to be influenced by the elasticity of supply and demand, recovery trends in belly freight, fuel costs, probability of reactive demand, and other macroeconomic factors.
Ocean Freight - Demand Commentary
- After a 5% increase in January, container trade demand declined to +0.6% year-to-date.
- Despite entering the traditional peak season period, export demand out of Asia has been tapering down following high inventory levels and record inflation in North America and Europe.
- Rates have been following the same trend with some additional capacity introduced.
- Demand remains soft and is expected to be relatively similar through the third quarter, subject to macroeconomic developments. Rates remain stable and elevated because of varying capacity adjustments like additions, cancellations, and high fuel prices.
- Global container volume growth is currently estimated to be around 3% this year - down from 7% in 2021.
- After a strong start to 2022 on most trades, global demand is shifting downward. High inventory levels built to cushion supply chain delays and inflation are decreasing the appetite for imports.
- Import and export ocean shipment volumes at Chinese ports have bounced back over the past weeks as lockdowns ease.
- Volume at the Port of Shanghai has increased since mid-May, with the 14-day average ocean shipment volume up 15% compared to 12 March and up 36 percent week-over-week for shipments.
- Volume at the Port of Shenzhen is up 53% compared with the Port of Ningbo-Zhoushan which is up 30% compared to 12 March.
- Dwell times for export shipments for Chinese ports have shown some signs of recovery over the past weeks.
- The 14-day average ocean dwell time for export shipments is now at 6.8 days, which is the same dwell time compared to 12 March. This is down 19 percent from the high seen earlier in June.
- Import dwell time at Chinese ports remains above levels seen pre-lockdown, with the 14-day average ocean dwell time now at 4.5 days. This is an 11% increase compared to 12 March.
- Overall ports across China moved a total of 142.3 million TEU over the first half of 2022, a 3% year-on-year increase.
- We see more production shift to SE Asia and, as a result, the demand for space and equipment exiting ports remains strong.
- Demand for Chinese products in Europe and the US is continuing to weaken into August, with no peak season volume surge.
- As Shanghai re-opens, we anticipate an increase in volume demand as manufacturers re-commence production, however it is unclear whether this will result in a tighter market in Q4.
- A significant number of blank sailings have balanced supply and demand; however, the current global economic environment means household income is reducing in real terms.
Ocean Freight – Supply Commentary
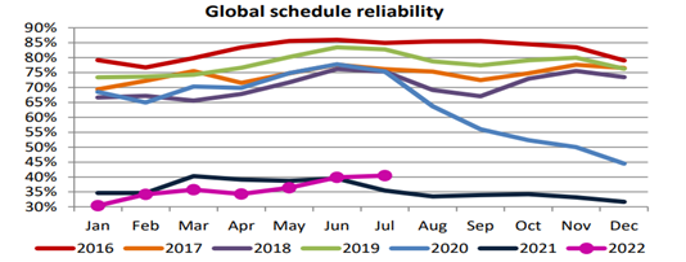
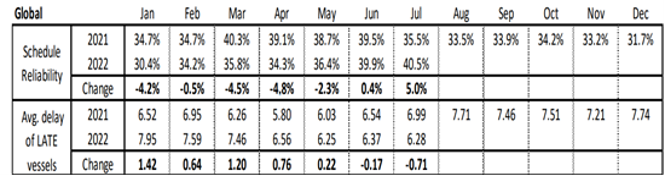
- The global on-time index improved in July 2022 reaching 40.5% - the highest figure recorded in 2022.
- July 2022 was the 3rd consecutive month that schedule reliability improved, although the latest increase was of a marginal 0.5 percentage points.
- That said, schedule reliability is now trending upwards - up 5.0 percentage points year-on-year, which is the second time we have seen an improvement since December 2019.
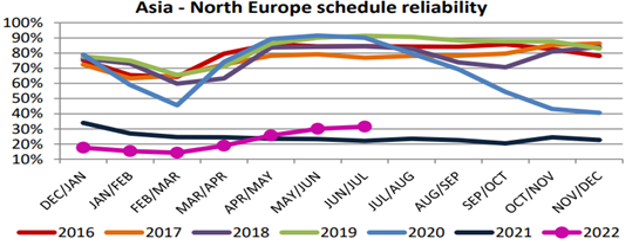
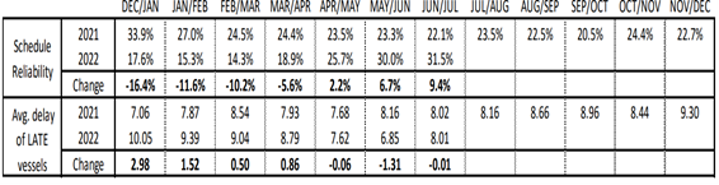
- Schedule reliability on the Asia-North Europe trade lane increased by 1.5 percentage points between June and July 2022, reaching 31.5%. This represents the second-lowest recorded figure for this month.
- June and July of this year saw schedule reliability increase by 9.4 percentage points compared to the same point last year.
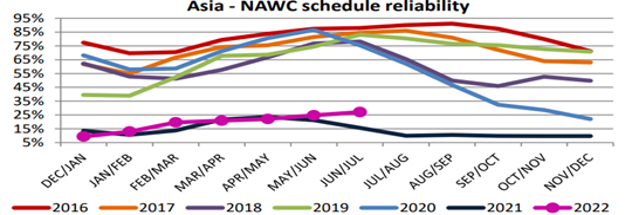
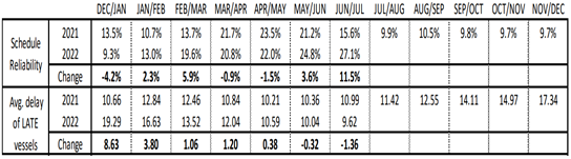
- Schedule reliability on the Asia-North America West Coast trade lane improved, increasing by 2.3 percentage points, and reached 27.1% in June and July 2022.
- Whilst this represents the second-lowest recorded figure for this month on the trade lane - on a year-over-year level, schedule reliability in June and July 2022 was 11.5 percentage points higher when compared with last year.
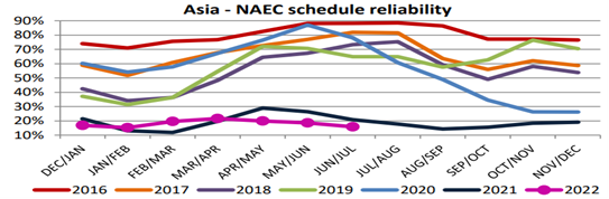
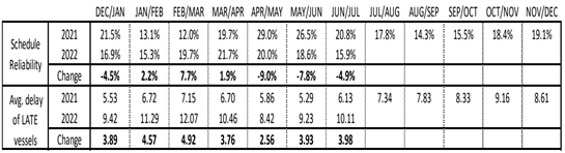
- Schedule reliability on Asia-North America East Coast continued its downwards trend, decreasing by 2.7 percentage points and reaching 15.9% in June and July 2022.
- Year-over-year, schedule reliability fell by 4.9 percentage points below the 20.8% recorded in June and July 2021.
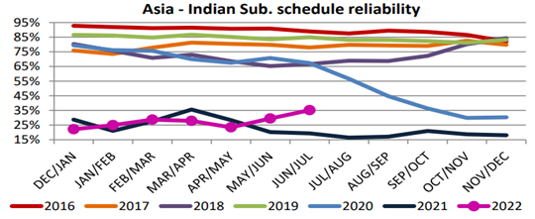
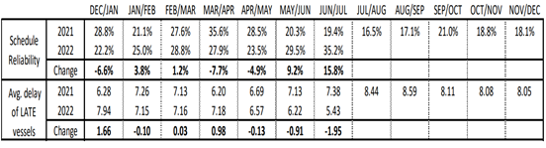
- Schedule reliability on the Asia-Indian Subcontinent trade lane increased by 5.8 percentage points in June and July 2022, reaching 35.2%.
- Whilst this is still the second lowest schedule reliability figure recorded for this month, on a year-over-year level, schedule reliability was 15.8 percentage points higher than at the same point in 2021.
- Current global ocean capacity shows only 10 carriers controlling 85% of the 25 million TEU world fleet.
- Furthermore, the same 10 companies are aggregated into 3 operational alliances through which they share the services, ships, and space.
- The consolidation of the market may moderate supply deployment as new ships are delivered.
Ocean Freight - Pricing situation
- Spot rates continue to drop due to weaker demand in the US and Europe, despite strong Chinese export figures reported for July.
- This reduction is temporarily plateauing as U.S. import demand remains still above pre-COVID levels, and some U.S. ports remain extremely congested plus ocean carriers are “blanking” or “voiding” sailings - both because their ships are stuck in port queues, and they are matching vessel supply with cargo demand.
- The outlook suggests that this will continue as port congestion pre-empted a steeper drop in spot rates.
- Even with support from congestion, the outlook for short-term rates will decline further in the months ahead.
- The long-term rate level remains high based on an elevated feeder charter rate and the steep increases in the bunker fuel costs. Escalating Bunker costs are expected to be ongoing due to Russia Ukraine conflict and a strong fuel demand worldwide.
- The global XSI® rose again in July to 453.2 points, representing a further month in which the XSI® has set a new record - up by 121.2% from August 2021.
- The Far East export index also rose by 2% in July to 634.89 points.
- On imports, the XSI® index rose to 220.68 points in July, 1.1% higher than the last month. The index has risen by 53% from July 2021 and 35% from the end of 2021.
- Along with softening global demand, other factors including weather conditions, low water levels in China, reduced productivity in Chinese factories and the government's continued to the pursuit of its zero-COVID policy are impacting Asian trade.
- Although spot indexes vary, they are generally all pointing in the same direction – there is no precipitous plunge in container shipping rates, but rather an orderly decline
- Fuel: In July 2022; the VLSFO-HSFO spread has reduced to $232 per tonne. However, the price of VLSFO remains on the high side
- Prices remain strongly influenced by external factors such as the price of crude oil and market forces of supply and demand.
- In the past two years, two separate events have had a profound effect on the price of VLSFO: the International Maritime Organization's sulfur cap on fuel oil in 2020 and, more recently, the Russian invasion of Ukraine.
Ocean Freight – Key Takeaways
- The decline in recent ocean spot rates and premium surcharges as demand for containers softened has reversed, with congestion at ports resulting in increasing prices for the U.S to Europe trade route and creating a floor in spot rates for the Asia to East Coast shipments.
- The outlook suggests global shippers should be prepared for short-term volatility.
- Patience will also be required, not only in terms of understanding how the dynamics develop, but also the distinct differences that exist across global markets.
- Traditional peak season in ocean shipping typically starts in August.
- The current backlog of containers at the ports will only increase congestion and add wait time for incoming vessels.
- Despite the usually inflating volume, peak season is anticipated to be flat. Potentially for the first time, we may witness lower transportation demand in the second half of the year compared with the first.
- Future bookings show the total container volume from all ports in China to all ports in the U.S is down, reflecting a slowdown in consumer spending.
- Big swings in the market were a result of lockdowns or slowdowns but slowing demand has supplanted that story.
- It is still early, but the outlook suggests we may experience significant headwinds stemming from uncertain global economies. It is therefore important to monitor the demand closely in the short to medium term.
- Despite decreasing orders, congestion and blank sailings continue to constrain supply.
- The mounting delays at some ports are leading to vessels returning to Asia out of position to fill their next scheduled inbound sailing.
- This will lead to a reduction in available capacity due to increased blank sailings, and ultimately higher transportation costs.
- Reduced volume may initially help dampen the upward price pressure, however, if we see volume increase the availability of space will tighten quickly.
- Heading into the Golden Week - the eight-day holiday in the first week of October in China - more sailings are also expected to be canceled as manufacturers shut down.
- Finally, the next phase of the IMO program to reduce carbon emissions in maritime will also take vessels out of rotation, putting more pressure on freight prices.
Ground Freight – Supply Commentary
- Conversion of air to ocean mode due to ongoing disruptions and high prices relative to some specific trade lanes have maintained demand.
- Courier mode that was impacted by the recent lockdown measures has returned to normal operations.
- DHL Express - in partnership with Singapore Airlines - will operate a 777 freighter three times per week to the U.S. via South Korea under a multi-aircraft outsourcing contract.
- The plane will add capacity on a key trade lane with growing e-commerce volumes and give DHLE more flexibility to add new routes and optimize aircraft utilization.
- Cross-border trucking between South China and Hong Kong is once again facing restrictions due to Covid-restrictions.
- Increasing Covid cases around Shenzhen have led to the city reducing daily cross-border truck movements from 3,500 to 1,500.
- The restrictions began on July 25th and have caused a reduction in truck capacity to around 10-20% of usual levels.
- Stricter testing policies have been reintroduced compelling truck drivers to provide a negative test result within 24 hours.
- Following the change, truck quotas have also been reduced by around 50%, reducing available capacity.
- The crossing at the border of China and Vietnam - namely Ping Xing and Dong Xing - has recommenced and truck mode is operating at normal levels.
AMERICAS
Market Overview
Air
- Revenue in Air Transport is projected to reach a market size of US$221.90bn this year.
- An annual growth rate of 7.28% is forecast between 2022 and 2025.
- Despite pandemic-related challenges remaining, air demand remains steady across the board with US airports returning to a normal pace.
- A busier than usual travel period in Canada has applied additional pressure to domestic airports.
- To manage the increase in demand, Air Canada has increased the number of flights out of all major airports.
Ocean
- Ocean container volumes continue to flow at substantial rates into the U.S West and East Coasts as shippers pull a large volume of inventory forward to mitigate potential delays in the run-up to peak shipping season.
- In a turnaround from the strained capacity that led to surging prices last year, freight demand in the U.S is showing signs of softening as we head into the peak season.
- Freight rates are falling from historic highs, and the flood of shipments from retailers and manufacturers is stagnating in some markets as high inflation and shifts in consumer buying patterns impact supply chains.
- Port backups have shifted from the west coast to the east coast. New York, Newark, and Savannah have extreme delays due to ships waiting at anchor.
Ground
- Capacity constraints have shifted from the ocean to land as companies tie up transport equipment, causing backups across freight networks.
- Containers required to ferry goods on trucks are facing delays whilst organizations store goods on the equipment as a result of warehouses reaching capacity.
- The practice is triggering lengthy delays at inland distribution hubs, including in Chicago and Kansas City.
- Following the intervention of the Government in September, U.S. railroads and unions averted mass strike action.
- Workers agreed not to strike until the union members accepted the deal. The agreement includes an immediate 14.1% pay raise and another 24% wage increase over five years, with the addition of a $1,000 lump-sum payment in each of the next five years.
Demand Commentary
Air
- Export demand remains steady across all markets as US airports return to a normal pace.
- Capacity is opening further as most carriers increase the number of passenger flights for their summer schedules.
- Shipments into Europe could experience additional destination dwell time due to the labor shortages in some western hubs.
- A heavy travel season in and out of Canada is putting a strain on the infrastructure of major airports which is having a trickle-down effect on cargo operations.
- This is resulting in extended dwell times for both import and export cargo.
- Air Canada has announced their intention to add additional flights on all major gateways.
- These flights are likely to include both passenger and freighter options
Ocean
- The Cass Freight Index - which measures shipping demand in the U.S - declined 1.7% from June to July, the second straight month-to-month reduction.
- The index edged up 0.4% year-on-year, but it remains barely above its level in January.
- In a clear reversal of trends, U.S. East Coast (USEC) ports are now handling more cargo than U.S. West Coast (USWC) ports.
- Historically, west coast ports handle 40% more volume than their counterparts in the east, however, demand is shifting and causing additional pressure, particularly in Savannah, Newark, and Houston.
- East coast ports continue to face congestion challenges with some vessel strings omitting Charleston and Savannah entirely.
- The Port of Long Beach reported its busiest July on record. From a peak of 109 cargo ships waiting to enter San Pedro Bay in January 2022, the number of ships in the immediate vicinity has been reduced to around 10.
- Erratic schedules are causing significant disruptions with changes in posted return dates and vessel cut-offs at the port.
- West coast arrivals and available capacity for LA is generally open, whereas Oakland and Seattle appear more fluid.
- Deficits on containers and chassis continue to plague Inland Port Intermodal origins with Chicago remaining the most reliable.
- Availability for standard equipment has not been an issue for most ports.
- Capacity from the US Southeast to India remains constrained due to continuing port omissions for Charleston and Savannah.
- Overall capacity for Indian ports requiring a transshipment service remains extremely tight from both the USEC and USWC.
- To ensure minimal disruption, we recommend that bookings are placed 4 weeks before the vessel’s Estimated Time of Departure.
Ground
- Congestion continues at the Montreal and Toronto terminals and inland ramps.
- The volume coming into Toronto continues to surge, while the number of drivers continues to decrease - translating into fewer drivers handling more volume, adding to existing congestion.
- The increased demand for trucks along the southern US board will continue as some manufacturing has shifted business there to help with supply chain problems getting freight from the far east into the US.
- The demand in the LTL market in the US and Mexico has decreased during Q3 and will probably continue to see this decrease due to consumer spending decreasing even through peak season.
Supply commentary
Air
- US airport operations continue to face pandemic-related challenges
- While recovery times at US airports remain elevated relative to pre-COVID conditions, there are fewer extreme delays as demand has softened.
- The export market has improved throughout the summer with spot pricing trending down on most lanes
- The international air market remains constrained due to passenger travel still not being back to pre-pandemic levels. Industry experts are predicting these levels will not return until 2025.
- The transatlantic lanes are picking up steam and getting more frequent and predictable volumes in those lanes.
Ocean
- The reliability of the inbound freight into the Americas is continuing to improve except for the South American East and west Coast destined freight. The reliability is still at an all-time low with an average of 35% OTP.
- With the consolidation of carriers over the last 20 years and only 3 operational alliances the market is very well meditated
- With the planned deliveries of new vessels over the next 12-24 months, the mode will continue to see additional supply available which will contribute to the continued increase in pricing.
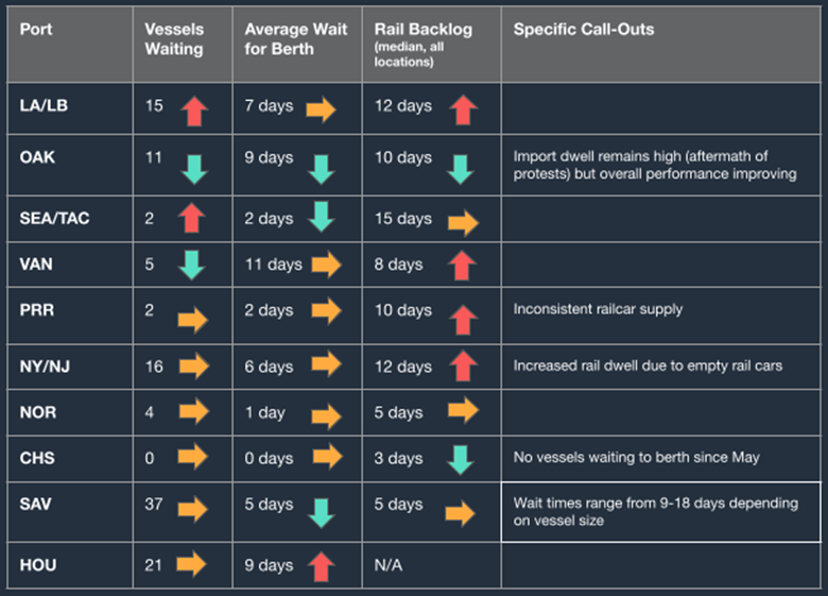
- Chassis shortages continue to persist, notably in Chicago, New York & New Jersey, Memphis, and LA.
- East coast and gulf congestion continued through August, with vessels at anchor in New York, Norfolk, and Savannah.
- At the end of July, 36 ships awaiting berths experienced wait times in the 7–10-day range.
- Congestion at LA, Long Beach, and Oakland has deteriorated, in part due to strike action. Oakland is experiencing 19-day terminal dwell times and LA, Long Beach is averaging 7.9 days.
Ground
- The domestic Full Truck Load market has been suffering from the inventory glut.
- Tender rejections by carriers have decreased by 67% year-on-year, from 22.8% to 7.4% - meaning carriers are accepting more loads due to having additional capacity.
- Load-to-Truck ratios are down in the region of 30% year-on-year, which is the key barometer for supply and demand in the market.
- U.S. railroads and unions averted strike action following an invention from the US Government.
- Roughly 40% of the nation’s long-distance trade moves by rail and the idling of 7,000 trains daily would trigger retail product shortages and widespread manufacturing shutdowns.
- Workers agreed not to strike until union members accepted the deal. The agreement includes an immediate 14.1% pay raise and another 24% wage increase over five years, with the addition of a $1,000 lump-sum payment in each of the next five years.
- However, despite the additional investment secured, strike action remains a threat until members approve their renegotiated contracts.
Pricing situation
Air
- Rising energy prices, especially jet fuel, are driving air freight operations costs upwards.
- The increase in jet fuel prices represents a major challenge as this cost typically accounts for 20% to 25% of total operational costs. The jet fuel price rose by more than 70% during the first 6 months of 2022, marking one of the steepest increases since at least 2002 and causing unprecedented pressure in terms of cost management for the airline industry. Source IATA
- This increase is buoyed by both soaring crude oil prices and cracks between jet fuel and oil. Following Russia’s invasion of Ukraine on 24 February 2022, the Brent crude oil price increased by over 30% due to a sudden loss of supply from Russia, which is the third largest oil producer in the world
- Labor shortages in North America are causing ground handling charges to increase.
- Tight labor markets do tend to push wages higher and with labor representing around 25% of airlines’ total costs, this could be a concern.
- However, wages have so far risen faster for low-paid jobs in the US, leading to a welcome reduction in wage inequality. The impact on the bottom line should therefore be limited for airlines insofar as salaries in the sector are higher than the average: in 2021 the average salary in the sector was 120,000 dollars per year in the US, against 58,000 dollars for all sectors.
- Transportation rates remain stable week over week.
Ocean
- Costs of shipping containerized freight from China to the West Coast of the United States increased significantly between January 2019 and August 2022. While in January 2019, the index amounted to about 716 points, in August 2022, the index reached a value of nearly 2,400 points. While the cost of shipping freight from China to the East Coast of the United States index reached the value of over 2,800 points.
- Rates: No GRI’s announced for September
- Forward-looking the rates will begin to decrease for Inbound Ocean freight from Asia to the Americas, the market is already seeing a soft beginning to the traditional peak season.
Ground
- The American Trucking Associations said in its annual salary survey that average wages for drivers of big rigs, from those working in for-hire commercial long-haul markets to employees at in-house fleets managed by companies like Walmart, Sysco and Pepsi reached $69,700 last year, up 11% from the previous year.
- Highway Diesel fuel prices are dropping but remain well above the start of the year East Coast ($5.30/gallon), Midwest($5.24/gallon), Gulf Coast ($4.91/gallon) West Coast ($5.98/gallon), California ($6.39/gallon) and Rocky Mountain($5.39/gallon)
- British Columbia, Quebec, and Ontario (~$7.44 CAD/gallon) inventory/sales ratios in history, global inflation, record high diesel fuel prices, and most recently the sharp drop in container imports.
- Spot rates in the market have bottomed out to a 16-month low, down ~35% YTD. Contract rates fell in recent weeks after an increase for the past several months due to FSC schedules.
- Tender volumes from customers are down 20% YoY.
- Diesel prices have pulled back slightly from all-time highs as we move past the summer peak season.
Supply Analysis
Air
- Following the initial hit of the covid-19 pandemic, domestic passenger markets were the first to rebound since domestic travel faced less uncertainty and fewer constraints than international travel. Also, two of the largest markets, the United States and China P.R., allowed inbound travel much earlier than the rest of the world, leading to a strong recovery in global numbers.
- Air cargo played an important role during the pandemic and CTKs remained above pre-pandemic levels throughout 2021.
- Benefitting from increased competitiveness compared to maritime cargo, the industry has recorded strong results including a doubling of air cargo revenues which in turn have tripled as a share of total airline revenue.
- Cargo volumes have retraced some of their gains over the past year (down 6.4%) but CTKs are currently 1% above their pre-pandemic level.
Ocean
- Congestion has worsened in the North Europe – US East Coast trade. Increased waiting times in ports such as Savannah, Houston, and New York add to the vessel’s delays experienced in the big North European hubs.
- Container ships deployed in regular alliance service on the North Atlantic currently arrive on average 13 days too late in Europe for their next voyage, up from 9 days in October last year.
- There are huge differences in vessel delays per carrier. This leads to the conclusion that good carrier terminal arrangements can limit the impact of liner service disruptions and reduce waiting times.
- Capacity situation remains tight in South America with only MSC being more flexible in the short-term, albeit at high rates and limited free times. Equipment situation not improving. Rates stabilizing, with all carriers extending rates into Q3, 2022.
Ground
- American Trucking Associations’ advanced seasonally adjusted (SA) For-Hire Truck Tonnage Index fell 1.1% in July after rising 0.5% in June.
- Tonnage declined sequentially in July for only the second time during the last twelve months. Despite the dip from June, tonnage remains at elevated levels and increased significantly from a year earlier.
- Compared with July 2021, the SA index increased 5.1%, which was the eleventh straight year-over-year gain. In June, the index was up 5.6% from a year earlier. Year-to-date, compared with the same period in 2021, tonnage was up 3.4%.
- The market is softening, but with peak season coming up there may be more loads than trucks to service them. As well as there is still a driver shortage in all areas of the Americas.
EUROPE
Market Overview
- There are tentative signs that the intercontinental freight market is beginning to return to some semblance of normality.
- Peak season usually begins in mid-August; however, it is anticipated that we will not experience a typical peak this year, with volumes remaining stable through the 4 weeks leading up to the October Golden Week.
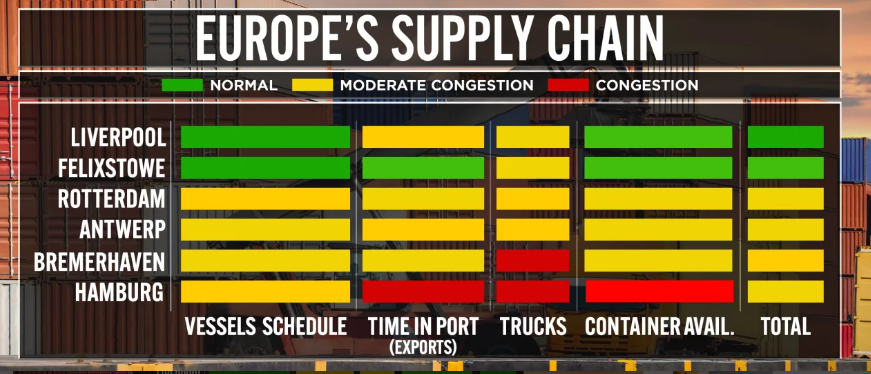
- Congestion at US ocean ports is improving however, strikes have caused disruption in Europe with difficulties experienced in Hamburg and Felixstowe.
- The German port strike has been resolved however - despite staff returning to work - there has been no settlement reached in Felixstowe.
- Like the Americas, the knock-on impact of the strikes on the freight network will take some time to resolve. Backlogs will be in place across the affected ports and neighboring ports will have experienced an increase in demand due to the diversion of vessels.
- As record inflation erodes buying power, there are signs of a winter of discontent in Europe with strikes expected in every part of the continent. Lufthansa pilots were the latest to strike over pay and conditions on the 2nd of September.
Demand Commentary
- Air freight load factors remain at around 90% traveling from Asia to Europe and the Americas.
- Available capacity increased on ocean freight because of several global macroeconomic factors - including the reduction in port congestion in the US, continued Covid-related lockdowns in China, and energy issues caused by high temperatures and scant rainfall.
- If inventory levels are high across the consumer sector in the US, then the implication is that there will be lower demand for freight. Therefore, reduced consumer spending in the US and Europe could end the spike in pandemic-related freight pricing.
- This also suggests that lower volumes traveling into the US from trans-Pacific routes will increase available space on ships, trucks, and aircraft and reduce the pricing power of freight transport providers.
- This will also be compounded by the fall in congestion, releasing further quantities of items such as shipping containers and cross-dock capacity whilst driving down freight rates.
Supply Commentary
- In the week ending August 21st, global air cargo demand was down 8% from the same week a year ago
- As with the boom in demand seen in the previous fiscal year, much of the impetus behind these developments is associated with US consumer behavior.
- Shippers’ inventory management operations are more under control, enabling container, demurrage, and warehousing systems to move back into more normal operating modes.
- Recent reports from major US retailers show that they are carrying high inventory levels. Consumer demand is lower than these companies anticipated leading to excess stock. The logical response to these issues is for retailers to reduce demand for the stock and thus for logistics services.
- None of these factors in isolation - either an operational improvement, muted US economic signals, or continued instability in China - will drive falling rates, but they do suggest a marked change of environment across the logistics markets.
Pricing Situation
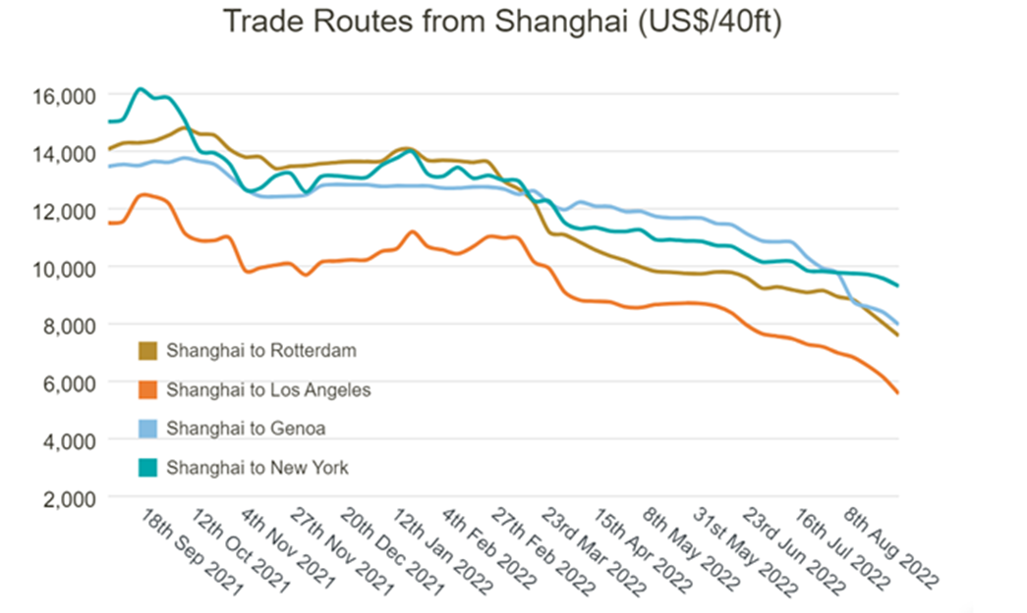
- Ocean Freight pricing is dropping sharply. Spot rates on multiple trades out of China declined 10% in August and the index fell by 37% year-on-year. Pricing is influenced by the demand, with the US to Europe rates falling much more than other trade lanes.
- Whilst jet fuel remains high, average global air freight rates are at their lowest level since September 2021.
- The downward trend is flattening now without any upturn so far. Last year, average air freight rates hit their lowest point in early July. However, this still means they are higher than pre-pandemic.
Supply Analysis
- European Road freight has increased partly due to fuel price increases but also due to new EU legislation designed to improve driver’s working conditions.
- The number of China-Europe freight train trips in 2022 hit the 10,000 mark on the 21st of August.
- Last year, this milestone was reached ten days later, according to the China State Railway Group.
- Although growth has slowed on the Eurasian corridor, this indicates that it has not stagnated.
- The usual growth of volumes has seen a downward trend this year.
- In 2021, freight train trips between Europe and China increased by 22 per cent and TEUs grew by 29 per cent.
- In 2020, the growth was respectively 50 per cent and 56 per cent. 2020 can however be considered as an exceptional year, considering that the start of the COVID-19 pandemic positively influenced rail freight traffic between China and Europe.
Back to Top