

By clicking the “I Accept” button, or by accessing, participating, or submitting any information, or using the Jabil Global Intelligence Portal or any of its associated software, you warrant that you are duly authorized to accept the Global Intelligence Portal Terms and Conditions on behalf of your Company, intending to be legally bound hereby, and your company shall be bound by the terms and provisions of the Global Intelligence Portal Terms and Conditions, accessible under the following link Portal T&Cs.
Jabil's Global Category Intelligence Archive
Global Category Intelligence
Q3 2023
Jabil's Global Category Intelligence Archive
Global Category Intelligence
Q3 2023
GLOBAL LOGISTICS
APAC
Market Overview
- Global air freight weakness continues with the observation of a low dynamic load factor contribution witnessing a fall to 57% registered in late April.
- The outlook for the air freight market continues to be poor, with a potential recovery unlikely before the end of this year, if not Q1 2024.
- The reopening of China, post their strict pandemic closure, did not yield the much-anticipated increase with recent data suggesting the easy gains have now been made and now low global demand is taking over.
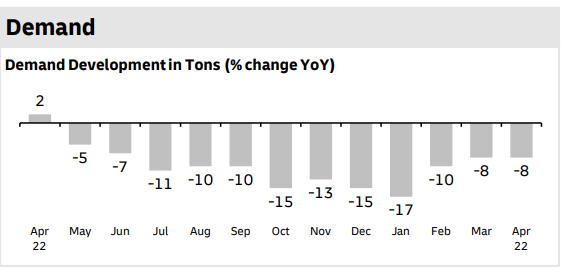
- On the supply side, compared to this time last year, global air freight capacity has risen 18.6%, versus just a 2% increase in chargeable weight.
- The ocean freight market similarly remains soft across many trade lanes, with cargo volumes weakening.
- In an ongoing environment of weak demand, carriers will continue slow-steaming ships, or sailing around the Cape of Good Hope, so they can continue to deploy their ships on trades without affecting the supply-demand balance.
- Shippers should therefore be wary of any attempts by carriers to portray the market as being tighter than it is.
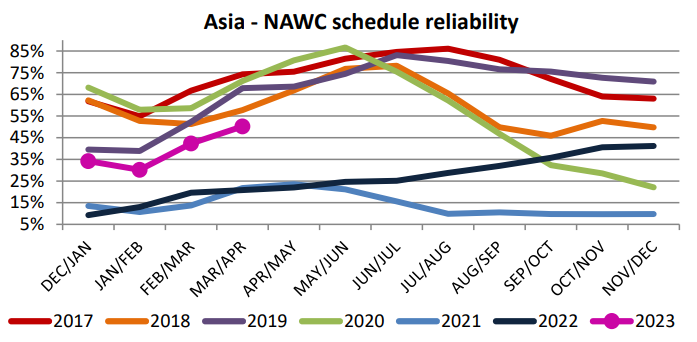
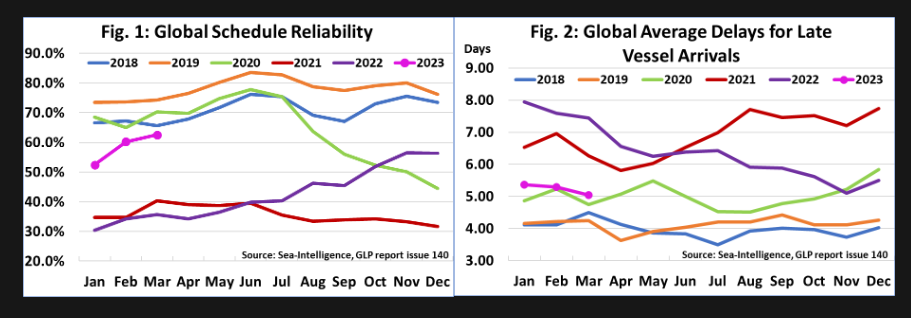
- Schedule reliability climbed to 62.6% in March, its highest level since August 2020. April also saw schedule reliability into the US (East and West Coast) from the Far East rise above 45 - 50%, something which hasn’t happened for a very long time.
- A landscape defined by falling volumes and easing congestion is identified as the key driver of this improved transit performance.
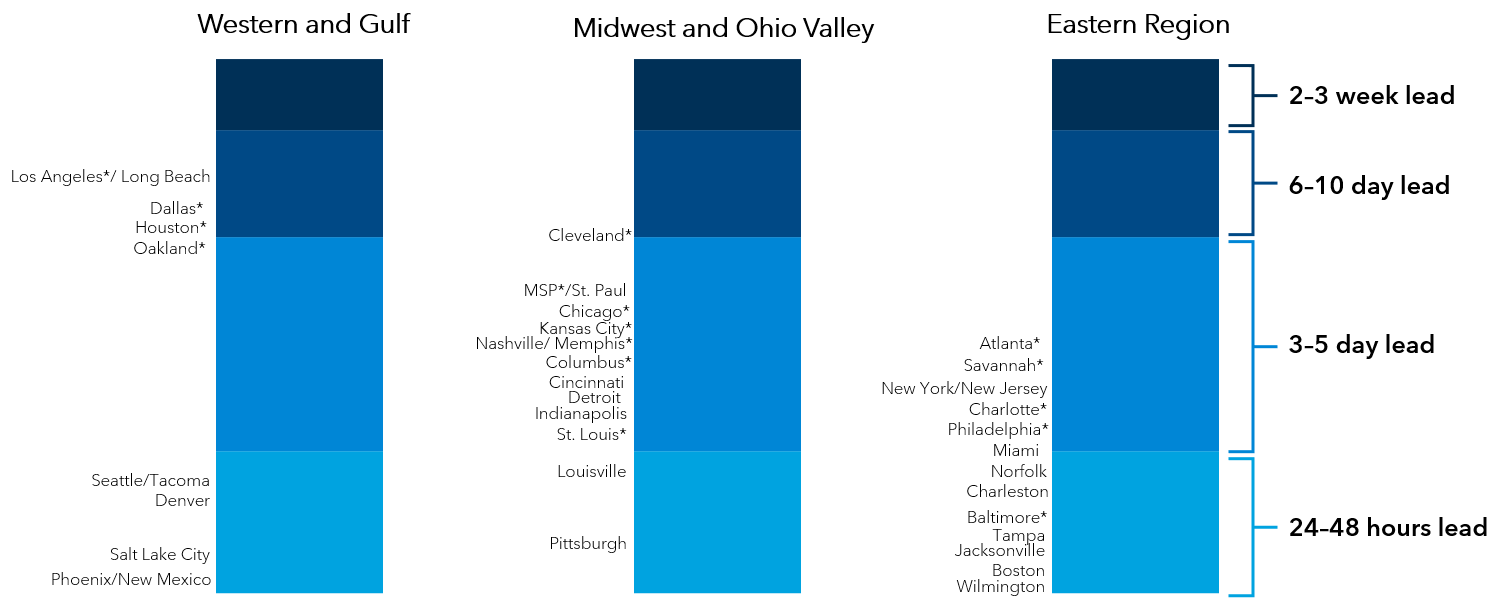
- Despite this increase in schedule reliability, we continue to recommend that a 1 to 2-week short-haul and 2 to 3 weeks long-haul lead-time extension is included in forecasts.
- Also, to ensure the robustness of service, it remains strongly recommended to provide a 4-week rolling forecast for both air and ocean modes, as well as placing bookings at least 1 week in advance for air mode and at least 3 - 4 weeks for the ocean.
- Courier freight mode and channels remain unchanged and is operating normally, however with elevated pricings/rates arising from GRIs and fuel costs.
- The domestic transportation market in China remains unchanged and is operating normally with available capacities.
- Cross-border ground transportation channels are operating normally including at the Chinese, Hong Kong,
- and South Asian borders. Capacities are available with all channels flowing.
Demand Commentary - Air
- The air freight market continues to suffer from low volumes, while the extra capacity from the summer season
- has pushed the global dynamic load factor down to 57%.
- Air freight demand continues to remain soft in lieu of a global economic slowdown with further observation.
- of the lack of a rebound post the re-opening of China from COVID restrictions. Comparatively low export orders from ASPA have been cited as a primary contributor to volume decline.
- Demand from China and other parts of Asia remains low, which is influencing the overall figures for global volumes and rates with forecasts of a possible pick-up later occurring late in the year.
- Market trends suggest that volumes are likely to remain soft/low with the outlook for any recovery in air freight demand - particularly in the short-term, and at a scale needed to lift the air cargo market from its current doldrums - remaining bleak.
- As such, a real change in market conditions should not be expected before much later this year, or only in 2024.
Demand Commentary - Ocean
- The global ocean market landscape remains soft, resulting from a challenging global macroeconomic environment.
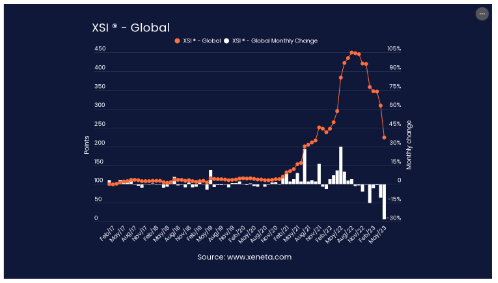
- The Global XSI suffered its largest ever month-on-month drop in May, falling by 27.5% from April to hit 224.0 points. This is now the lowest Global XSI level since October 2021.
- May’s fall marks the ninth consecutive month of declines for the global XSI. reflecting the realities of today’s subdued markets.
- Just as May this year saw the largest month-on-month drop in XSI history, this time last year saw the biggest increase. It also means that year-on-year comparisons are now in negative territory for the first time since late 2020. The global XSI in May 2023 is 42% lower than it was in May 2022.
- China exports are not recovering at the anticipated pace; no cargo rush had taken place this year, before the Easter holidays.
- The demand from SE Asia is also observed to be soft with the only exception being Vietnam which is showing at 80-87% utilization. Meanwhile, Thailand and Indonesia are not seeing any cargo rush, which is the usual case leading into their regional holiday season period.
- Service reliability is improving for the intra-regional trades and utilization is also trending upwards as carriers are fitting capacity better to existing demand output which is resulting in increasing freight levels on various corridors.
- Overall carriers are continuing with structural blank sailings for some services. Hence, for time-sensitive shipments, advance bookings are strongly recommended, preferably on direct service as well.
Demand Commentary - Ground
- Demand remains unchanged on the soft side which has been cited as mainly arising from softness in the
- trans-Pacific trade lanes volumes.
- All channels are operating normally and flowing with sufficient capacities to support.
- Asia's domestic truck freight mode remains unchanged, including within domestic China as well as cross-border trade lanes across Hong Kong and SE Asia.
- Demand the observed as stable and picking up with the opening of CN post-COVID restrictions.
Supply Commentary - Air
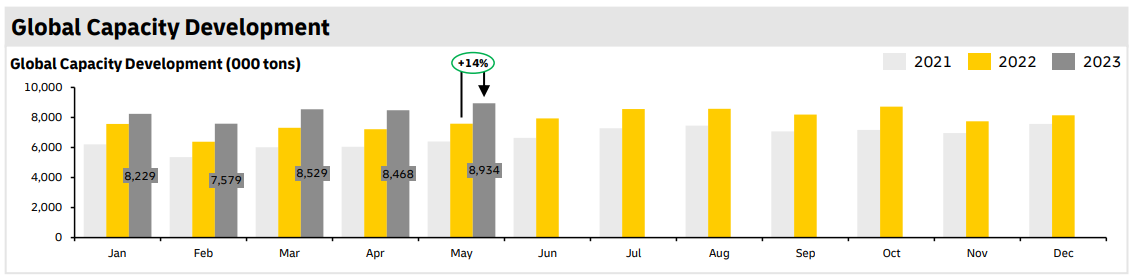
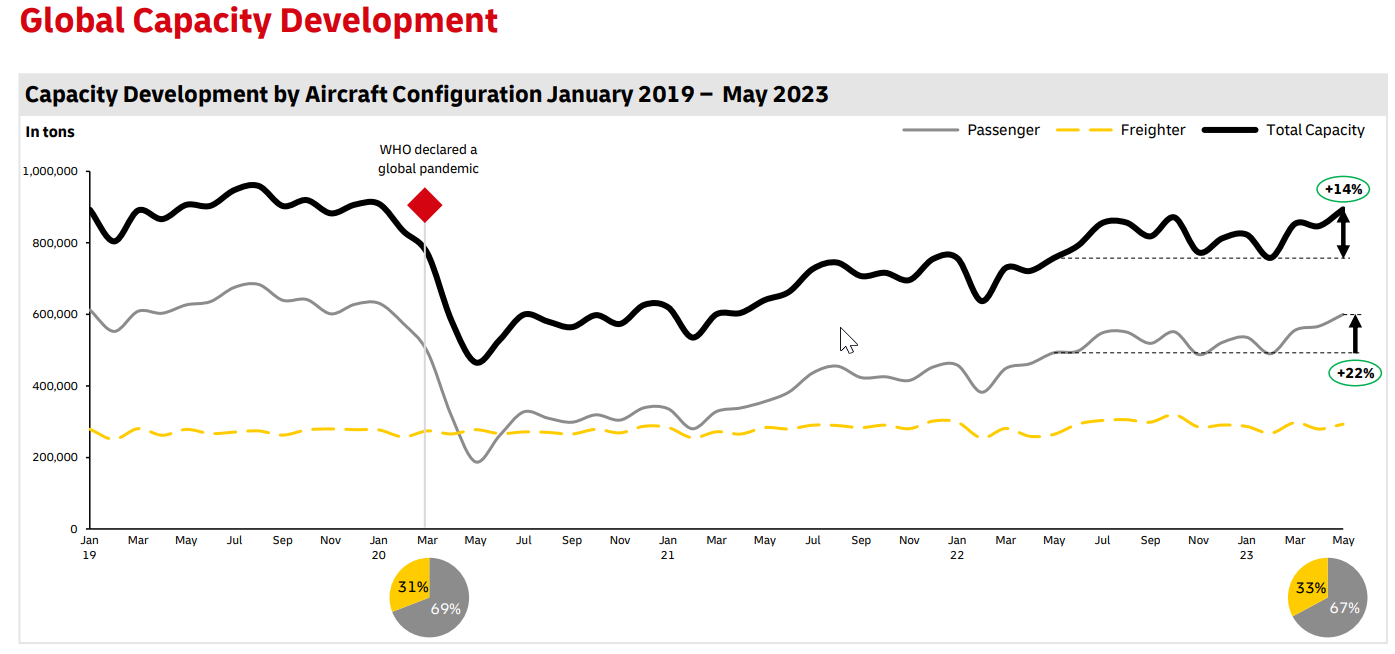
- Global capacity compared to this time last year has risen +14%; with belly capacity growth YoY ~22% as the continuing recovery of the global PAX market across all regions is observed with air capacity out from China increasing by 163.3% in late April.
- Capacity remains sufficient on most trade lanes in the market as cargo volumes remain low.
- Flat volume growth against improved capacity has led to reduced load factors in all regions with cargo load factor (CLF)—an indicator of demand and supply balance—reflecting an industry-wide CLF decreasing by ~9 Pts YoY in Mar ’23. This suggests utilization is likely to remain balanced under the current demand-vs-capacity situation.
- Exports from China and Hong Kong remain at sufficient supply to support current low/soft demand.
- Southeast Asia markets overall remain similarly soft/ low, as well, with widely available capacity.
- Exports from India/Bangladesh—demand is soft/low and with sufficiently available capacity to support.
Supply Commentary - Ocean
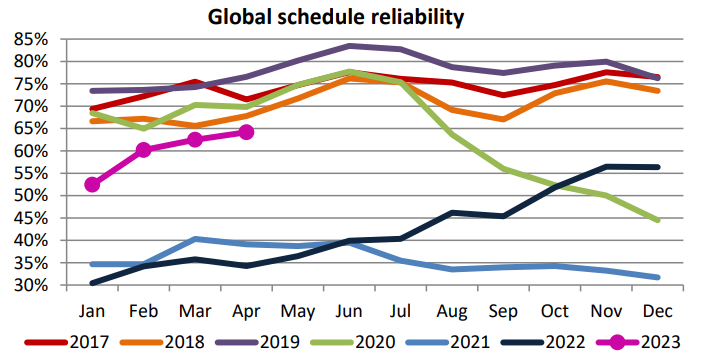
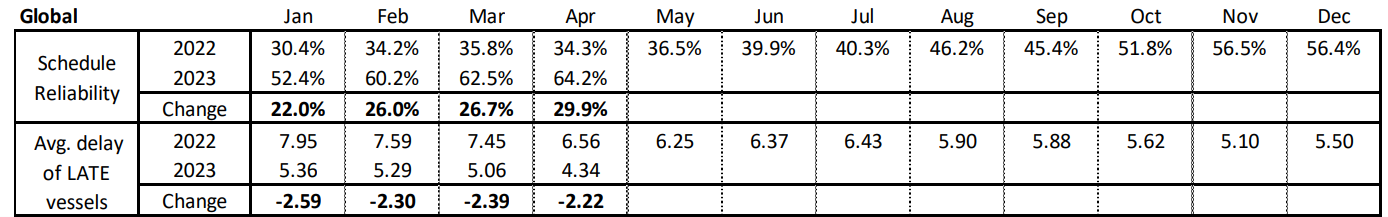
- Global schedule reliability has continued to improve M/M, although the strength of the improvements have declined with each subsequent month.
- In April 2023, schedule reliability improved by 1.7 percentage points M/M to 64.2%, a massive 29.9 percentage points higher Y/Y, yet ‘only’ 5.6 percentage points lower than the closest pre-pandemic scores.
- The average delay for LATE vessel arrivals also continued to decrease, following the contrary trend—i.e., an increase in the strength of the M/M improvement.
- In April 2023, the average delay figure dropped by -0.72 days M/M to 4.34 days. This is a massive -2.22 days lower Y/Y and is now also lower than the corresponding 2020 figure.
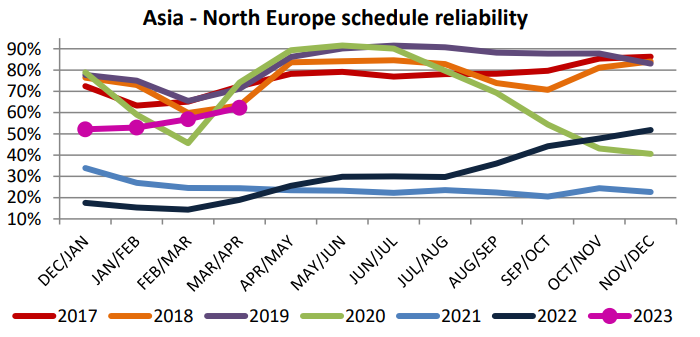
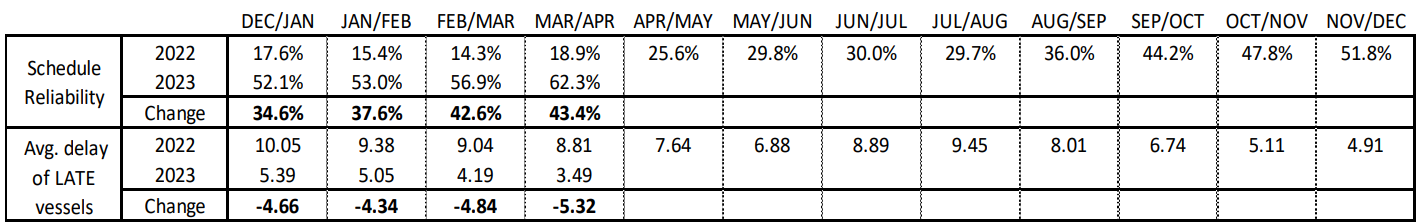
- Schedule reliability on the Asia-North Europe trade lane increased by 5.4 percentage points M/M in
- March/April 2023, reaching 62.3%. On a Y/Y level, March/April 2023 schedule reliability was higher by 43.4 percentage points compared to the same point last year.
- The average delay for LATE vessel arrivals also improved, decreasing by -0.70 days M/M to 3.49 days. On
- a Y/Y level, the delay was -5.32 days lower than at the same point in 2022. The average delay for ALL vessel arrivals decreased M/M in March/April 2023 by -0.48 days to 1.12 days.
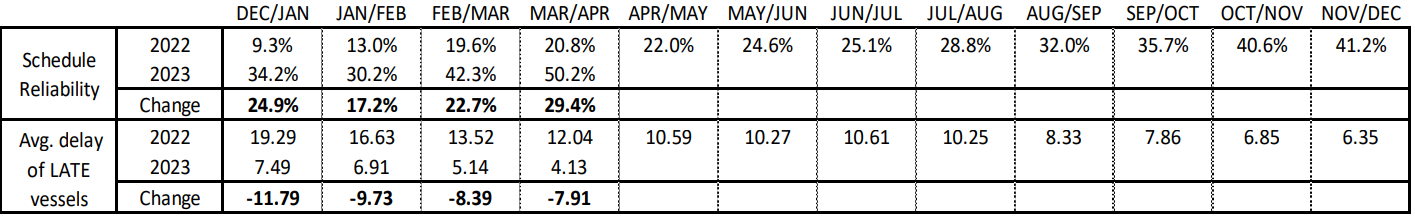
- Schedule reliability on the Asia-North America West Coast trade lane increased by 7.9 percentage points M/M in March/April 2023 to 50.2%. This is higher than the respective figures of the past two years. On a Y/Y level, schedule reliability in March/April 2023 was higher by a massive 29.4 percentage points, compared to the 20.8% recorded at the same time last year.
- The average delay for LATE vessel arrivals also improved, decreasing by -1.00 days M/M to 4.13 days in March/April 2023. This figure is better than that of the previous two years. On a Y/Y level, the delay was lower by -7.91 days. The average delay for ALL vessel arrivals decreased M/M by -0.88 days to 1.74 days.
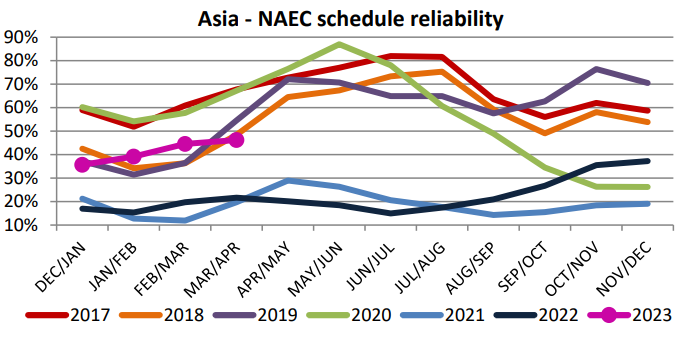
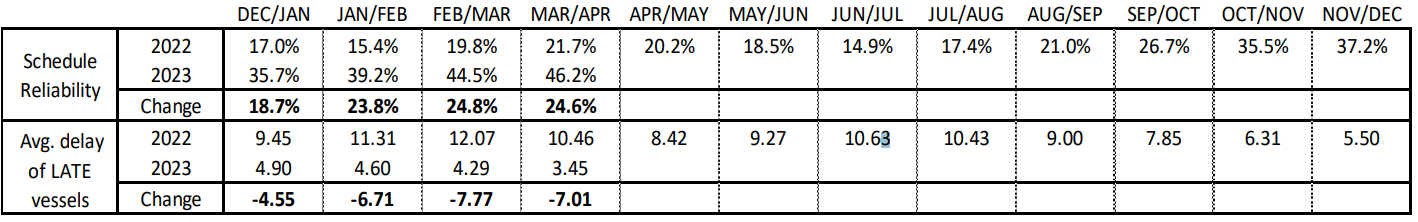
- Schedule reliability on Asia-North America East Coast increased by 1.7 percentage points M/M and reached 46.2% in March/April 2023. On a Y/Y level, schedule reliability was 24.6 percentage points higher than the 21.7% recorded at the same time last year.
- The average delay for LATE vessel arrivals also improved, decreasing by -0.85 days M/M to 3.45 days. On a Y/Y level, the delay was a massive -7.01 days lower than in 2022. The average delay for ALL vessel arrivals decreased M/M in March/April 2023 by -0.01 days to 1.73 days.
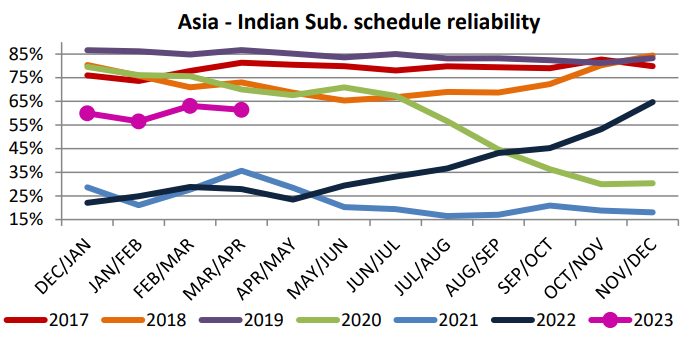
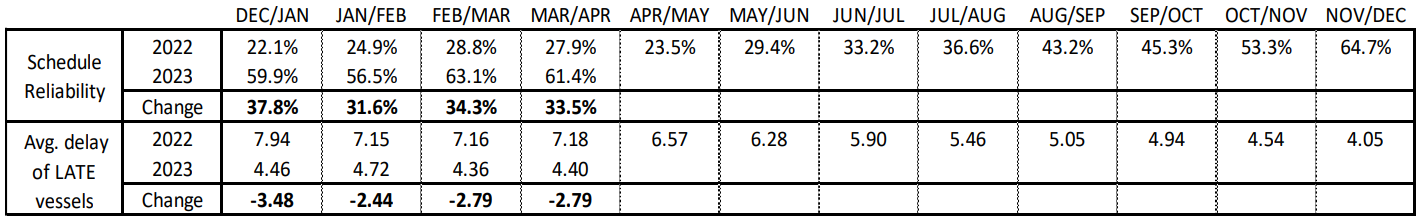
- Schedule reliability on the Asia-Indian Subcontinent trade lane decreased by -1.6 percentage points M/M in March/April 2023, reaching 61.4%. On a Y/Y level, schedule reliability was 33.5 percentage points higher than at the same point in 2022.
- At 4.40 days, the average delay for LATE vessel arrivals deteriorated, increasing by 0.03 days M/M. On a Y/Y level, the average delay was lower by -2.79 days compared to the same point in 2022. The average delay for ALL vessel arrivals increased M/M by 0.20 days to 1.50 days.
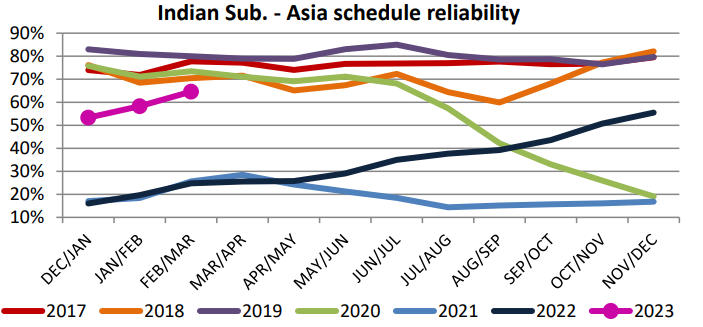
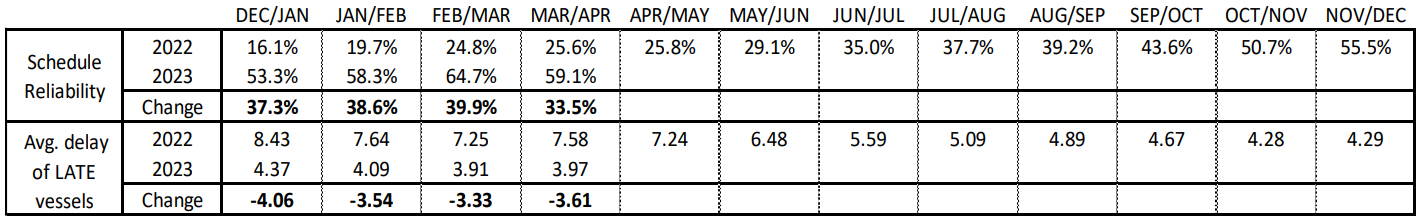
- Schedule reliability on the Indian Subcontinent-Asia trade lane declined M/M by -5.6 percentage points in March/April 2023, reaching 59.1%. On a Y/Y level, March/April 2023 schedule reliability was 33.5 percentage points higher than the 25.6% recorded at the same point in 2022.
- The average delay for LATE vessel arrivals also deteriorated, increasing by 0.06 days M/M and reaching 3.97 days. On a Y/Y level, March/April 2023 average delay was -3.61 days lower than at the same point in 2022. The average delay for ALL vessel arrivals increased M/M by 0.35 days to 1.33 days.
Supply Commentary - Ground
- Capacities remain available and able to support on all trade lanes and all channels are operating as normal.
- Capacities remain available and with all channels flowing.
- Customs clearance at borders between Shenzhen / Hong Kong as well as at border crossings between China and Vietnam are flowing and operating normally.
Pricing Situation - Air
- The market remains soft/ low and with sufficient capacity on most trade lanes with rates remaining aggressive and competitive. The last week of April witnessed the average global air freight rate fall to its lowest level since the start of the pandemic, in Q1 2020. The average is now 33.7% down, year-on-year. This marks the biggest year-on-year decline since 2019, and one of the biggest ever recorded.
- A low dynamic load factor is a major contributor to this, with a decline to 57% registered in late April.
- Compared to this time last year, global air freight capacity has risen 14.0%, compared to just a 2% increase in chargeable weight. At the same time, the start of the airlines’ summer schedules has also resulted in a large increase in capacity on many trades, where an even bigger year-on-year increase can be observed, with capacity out of China up a huge 163.3% in late April.
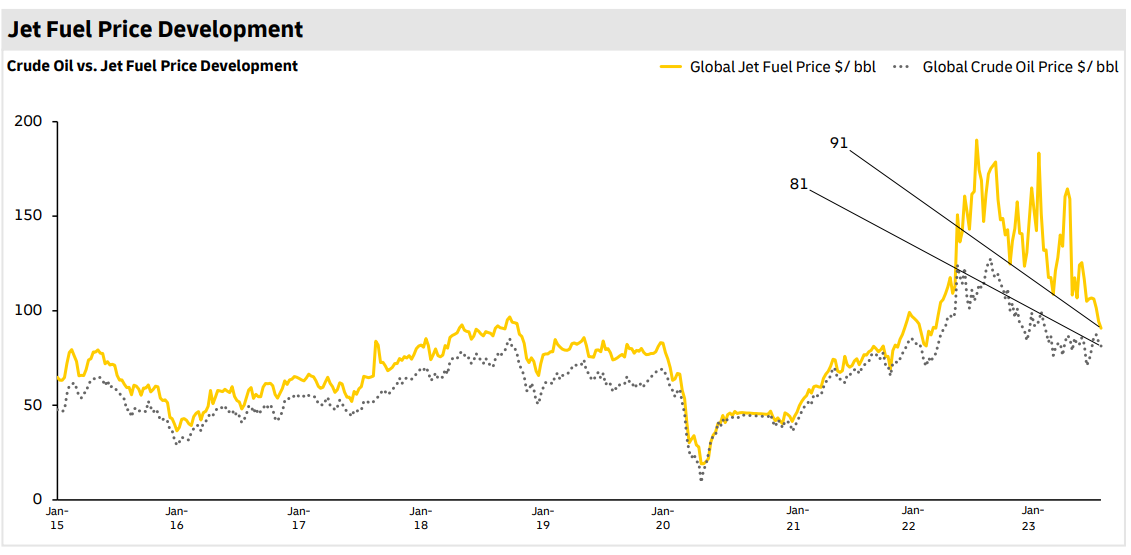
- High jet fuel prices, on the other hand, continue to impact rates conversely, remaining higher than normal at > USD 90/Bbl. The decision by OPEC+ to continue to cut production for liquid fuels directly impacts the EIA’s forecast for Brent crude oil pricing, which is likely to remain high on average throughout 2023.
- Concurrently, dependency on crude oil from Russia is now shifting to other OPEC countries. This shift in market dynamics will keep crude oil prices volatile, with production declines plus export disruptions in Iraq—and force majeure limitation from Nigeria—also expected to weigh upon near-term forecast for 2023.
Pricing Situation - Ocean
- The container shipping industry is facing a challenging time with global long-term ocean freight rates plummeting.
- In May 2023, the market’s witnessed an unprecedented decline in container rates, as the global Xeneta Shipping Index (XSI®) recorded its largest-ever month-on-month drop of 27.5%. This slump marks the ninth consecutive month of rate decreases, resulting in the lowest XSI level since October 2021.
- The cited reason behind this decline was the introduction of numerous new contracts reflecting low market demand and high capacity. As a result, all regional trade lanes observed similar month-on-month declines.
- This collapse in long-term rates will be particularly painful for carriers, many of whom have relied on higher long-term rates to make up for the loss-making spot rates that have been prevalent over recent months.
- The carriers’ Q1 financial reports detailed a decline in average freight rates, but with this latest XSI drop the pressure will be escalating, especially for those carriers most exposed to the long-term market.
- Container rates have decreased by 13.6% in 2023, since the beginning of the year, marking the
- eighth consecutive month of decline—undoubtedly one of the most remarkable periods of decline. As these dynamics continue, they are adding to the strain on carrier rates, which had already been experiencing a decrease since Q4 of last year.
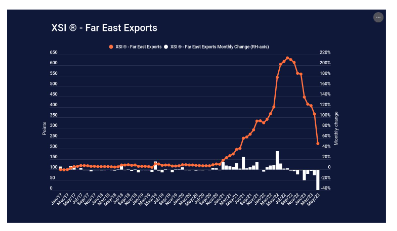
- The XSI for Far East exports fell by 38.6% in May, down to 225.0 points. This is now considerably less than
- half of the index’s value at the end of last year. Compared to May 2022 the XSI for Far East exports have fallen by 58.5%.
- Demand for exports out of the Far East continues to fall year-on-year. The end of China’s COVID restrictions may facilitate more positive volume developments out of the region, but without the demand for its exports elsewhere, there is little to drive any extra activity.
- After posting two months of month-on-month growth in February and March, the latest reading for the manufacturing PMI’s new export order sub-index has once again shown a decline. Prior to February’s gain, we have to travel back to April 2021 to see the last time the new export order sub-index registered growth.
- However, although exports out of the Far East are facing low demand, carriers have been able to
- improve their filling factor slightly due to a reduction in capacity.
- By removing services and blanking sailings, the average filling factor from the Far East to Europe, the US, and the eastern coast of South America increased from 84% in Q4 2022 to 87% in Q1 2023.
- Despite that, this is still lower by a few percentage points than the highs in 2021 and 2022—a remarkable accomplishment, given the 14.0% drop in volumes out of the Far East.
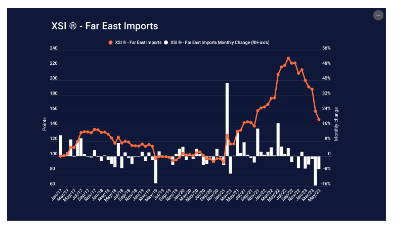
- From an import perspective, the XSI for Far East imports fell by 6.9% in May, down to 148.5 points.
- The index is now down by 28.6% year-on-year which is its lowest level since October 2021.
Pricing Situation - Ground
- Pricing levels remain elevated with the imposition of GPIs by carriers as well as heightened fuel surcharges, although with some relief from the cessation of the Emergency Service Surcharge (ESS).
Key Takeaways - Air
- The outlook for the air freight market continues to be poor, with a potential recovery unlikely before the end of this year, if not Q1 of 2024.
- China’s manufacturing activity and export volumes have picked up since COVID restrictions were lifted, but recent data suggests that easy gains have now been made and low global demand is now taking over.
- After posting decade-high growth in February, and further growth in March, the PMI fell to 49.3 in April, indicating a month-on-month contraction.
- Capacity out of China is expected to continue increasing, with both passenger and cargo airlines adding more connections. However, the increase in capacity is unlikely to be met by a similar increase in demand, leading to lower filling factors and lower rates.
- This is also the case in other major trades, where the higher capacity from airlines’ summer schedules is unlikely to be filled as demand remains subdued.
Key Takeaways - Ocean
- The overall global ocean market landscape remains soft resulting from a challenging global macro-economic environment and is clearly a buyer’s market.
- Regardless of their strategies, the current market conditions are challenging for carriers. as they continue to search for some sort of equilibrium between supply and demand, and the means with which to try to sustain profitability and operational / service levels.
- As carriers continue to try and navigate this ‘buyers’ market, they will continue to face the realities of a softer world economy, specifically, one defined by rising interest rates, inflation, unpredictable energy prices, geopolitical turmoil, and overall uncertainty. It is, to say the least, a challenging business environment.
AMERICAS
Market Overview
- Over the previous quarter, the logistics industry experienced continued growth in e-commerce, the increased adoption of advanced technology, and a continuation of the focus on environmental, social, and governance issues, alongside the overall slowdown of the economy.
- Trends such as the steady decline in spot rates, a decline in diesel and shipping rates, and an increase in the number of organizations exploring the adoption of artificial intelligence and machine learning were also prominent.
Market Overview - Air
- Total air traffic in February 2023 rose 55.5% compared to February 2022. Globally, traffic is now at 84.9% of February 2019 levels.
- North American carriers’ traffic climbed 67.4% in February 2023 versus the 2022 period.
- Capacity increased by 39.5%, and the load factor rose 12.8 percentage points to 76.6%.
- Latin American airlines had a 44.1% traffic increase compared to the same month in 2022.
- February capacity climbed 34.0% and the load factor rose 5.8 percentage points to 82.7%, the highest among the regions.
- As a result, the capacity of passenger aircraft for transportation is increasing, particularly as we enter the travel-heavy summer schedule.
- Transatlantic capacity and demand remain relatively stable, with low demand contributing to market conditions in both the US and EU.
Market Overview - Ocean
- Ocean freight demand on most trade lanes is not experiencing significant growth and remains relatively stable.
- To address the surplus of supply, steamship lines are canceling sailings to maintain a balance between supply and demand.
- On the return trips of major East-West services, steamship lines are implementing slow steaming, which involves reducing vessel speed. This strategy allows them to allocate more capacity per service and reduce fuel costs.
- Although congestion issues have largely been resolved, some flexibility is still necessary due to ongoing blank sailings and service adjustments.
- These blank sailings and service adjustments can impact lead times, requiring businesses to account for potential delays in their logistics planning.
Market Overview - Ground
- Demand for road services in the United States has softened, and lower diesel costs are a welcome relief.
- Labor disruptions continue to be potential problems.
- The International Longshore and Warehouse Union (ILWU) negotiations in Canada and the U.S. West Coast are underway. UPS and the Teamsters have begun negotiations on their contract that expires on 1 August
Demand Commentary - Air
- Direct passenger flights between the United States and China have decreased by 73% compared to pre-pandemic levels in North America this year.
- U.S.-based airlines are currently allowed a total of 12 round-trip flights per week, while China-based airlines were previously permitted 8, but this number was increased to 12 in early May.
- The most efficient flight path between China and the United States passes through Russian airspace, which U.S.-based airlines are not allowed to enter.
- However, China-based airlines can utilize this route, giving them a significant cost advantage. Consequently, ticket prices on China-based airlines are approximately 40% cheaper compared to their U.S. counterparts.
- Demand for air freight between the United States and China remains relatively low, and the current capacity is sufficient to handle it.
- When additional capacity becomes available in the future, it is expected to lead to further declines in air freight rates. The timing of this capacity increase is uncertain.
- Export conditions in Latin America vary across different countries.
- The northbound “Seed Season” from Chile, Argentina, and Uruguay began in early March and will continue until mid-May. This season is primarily supported by dedicated charter programs.
- In Argentina, seed volumes are relatively low, and there is available capacity from Buenos Aires.
- Brazil’s capacity and rates are stable on major routes.
- Colombia’s flower season reached its peak in April, leading to increased capacity from Miami and attractive spot rates.
- Southbound capacity from Miami is available for most markets.
Demand Commentary - Ocean
- As congestion eases globally, ocean carrier schedule reliability improved to 62.6% in March 2023.
- The year-over-year import numbers have remained relatively low due to inflation and a return to normal demand from major importers such as retail, furniture, electronics, and do-it-yourself industries, which together make up more than 50% of U.S. imports.
- Many shipping companies are holding off on placing more orders, while seasonal shippers have yet to start increasing their shipment volumes.
- In April, the volume of container imports in the U.S. increased by over 2 million twenty-foot equivalent units (TEUs), which is approximately 9% higher than in March.
- This represents a 5.3% increase compared to April 2019, before the pandemic. If the trend continues in line with 2019, May should see a further increase over April, albeit a small one.
- Although there have been some slowdown actions at the Los Angeles and Long Beach terminals, they haven't significantly affected the flow of cargo. However, shippers are increasingly considering the USEC (the United States East Coast) and Gulf ports as alternative options. This confirms the shifts that took place during the pandemic.
- Generally, there is ample capacity for U.S. exports, and rates continue to decrease. It is expected that more capacity will enter the market in the coming months to support the growing demand for travel.
- U.S. supply chains are also increasingly steering away from China.
- Imports into the U.S. rose 1.5% from March to April, but China’s share of goods shipments fell to the lowest level since 2006, receding to 15.4% based on value for the 12 months ending in April.
- A severe drought in Central America is cutting containership capacity and increasing shipping costs through the Panama Canal.
- Lake Gatun, which provides the freshwater needed to lift vessels over a series of canal locks from the Pacific to the Atlantic, is suffering historically low water levels this year and the drought is projected to get worse through the summer.
- Almost every container ship at the port complex of Los Angeles and Long Beach is seeing delayed departures or is waiting for a berth, as labor-related disruptions continue on the West Coast.
- Members of the International Longshore and Warehouse Union stopped operations at some marine terminals at the port of Los Angeles.
- This is resulting in every container vessel having their schedule pushed back by several days.
Demand Commentary - Ground
- Truckers in North America have faced significant challenges as freight demand slowed over the past year.
- The latest Truckstop survey suggests that spot truckload demand and rates may have reached their lowest point.
- Expectations for demand and rates in the next three to six months have improved, signaling a shift in sentiment.
- Seasonal trends and the exit of higher-cost capacity from the market are expected to contribute to improved conditions.
- 60% of respondents anticipate an increase in volumes over the next three to six months, a significant increase compared to the previous quarter.
- Soft demand and higher costs were cited as the main reasons for not purchasing equipment.
- 79% of respondents believe the US is already in a recession or near one.
- There is no consensus on when spot rates will bottom, with 29% expecting it in the fourth quarter and 28% believing it already happened in the previous quarter.
- Another report shows a 4% decline in freight shipments in March compared to the previous year, influenced by high inventory levels and a global economic slowdown.
- Fires in Alberta have delayed rail moves, causing yard utilization to exceed 95% in Vancouver.
- U.S. wet ports are largely fluid, with truck turn times under one hour at most ports.
- US Government stats show that:
- The total transborder freight moved by all modes of transport stood at $141.5 billion, down 0.3% compared to March 2022
- Freight between the U.S. and Canada totaled $69.4 billion, down 4.8% from March 2022
- Freight between the U.S. and Mexico totaled $72.1 billion, up 4.5% from March 2022
- Trucks moved $90.2 billion of freight, up 5.4% compared to March 2022 with increased exports of electrical machinery, computers, and vehicle parts from Mexico.
- Railways moved $18.6 billion of freight, down 7.9% compared to March 2022
Supply Commentary - Air
- The Global Air Freight Forwarding market recorded increased capacity offset by lower demand, leading to a decline in volumes as shippers continued to rely on cheaper modes of transport amid labor challenges and high inflation.
- However, in March 2023, air freight volumes showed a 3% YoY decline (the smallest monthly decline in over a year), indicating that global air cargo demand and pricing might be stabilizing.
- Overall, the market saw an 11% YoY decline in tonnages, compared with a 13% decline for 4Q22.
Supply Commentary - Ocean
- Ocean carriers shifted vessel capacity from USWC to USEC ports over the course of H1 2022.
- This was partly to address the significant congestion issues at USWC ports, and the demand from US importers for an alternative routing solution in the event of labor disruptions at LALB port this summer while the new labor contract is being negotiated.
- This shift in volume has been so significant that New York port handled the most containerized volumes during Q4 2022, taking the number 1 position from LALB ports.
- Due to decreasing import volumes primarily on the TPEB trade, congestion on the USEC and USGC ports has been significantly reduced over the past few weeks.
- However, space capacity continues to be tight for exports ex USEC ports to Asia due to blank sailings and slow steaming from the ocean carriers, some lingering congestion, as well as Midwest rail cargo being diverted to USEC ports by some carriers due to rail issues shipping to USWC ports.
- On 15 May, Descartes Datamyne reported that container shipments from Asian countries to the US were down 19% year-over-year in April and down 24% y-o-y in January-April. Despite progress in curbing containership supply, transport volumes have not yet recovered.
- Generally, demand on the Transpacific Lane remains weak. It appears that spot rates are at loss-making levels on most trade lanes.
- Overall, capacity is 12% below the recent peak in June 2022 for the Transpacific, Asia-Europe, and Transatlantic routes.
Supply Commentary - Ground
- The annual harvest season in the United States creates capacity and pricing challenges in the trucking marketplace.
- Produce season is the annual harvest of fresh fruits and vegetables as the growing season moves from the South to the North.
- The harvest season leads to regional pressure on refrigerated and dry van capacity, as capacity follows the harvest and distribution.
- This year, the trucking market is oversupplied, and there are no significant capacity and pricing challenges expected during the produce season.
- Refrigerated trucks participate in the dry van market when they are not carrying loads that require refrigeration.
- During the harvest season, refrigerated capacity is pulled away from the dry van market to transport fresh produce, causing regional tension.
- The broader refrigerated trucking market does not serve fresh produce, leading to pressure on a sub-segment of refrigerated trucking.
- Some key growing regions and corridors may face a shortage of fresh produce capacity during the harvest season.
- Harvest season has started in Florida and Georgia, which are the first markets to harvest and generate demand for refrigerated trucks.
- The available load volume in the spot market steadily increases, reaching a peak plateau around week 20 and lasting for about 10 weeks.
- Capacity migrates to match the load demand, resulting in a load-to-truck ratio (LTR) that affects both refrigerated and dry van markets.
Pricing Situation - Air
- Brent crude oil spot price fell from an average of $85/Bbl in April to $73/Bbl in May ‘23
- Economic slowdown indicates lower fuel consumption which reflects in the gradual reduction in prices.
- The expected seasonal rise in consumption and OPEC+ decision to cut production are likely to put upward pressure on crude prices; Jet fuel prices are thus expected to remain on the higher side.
- EIA expects oil production to outpace demand at the beginning of 2024 and forecasted the average at an average of $74/Bbl, lower compared to this year.
- Production decline from Russia, export disruptions in Iraq, and force majeure limitation from Nigeria limit the near term.
Pricing Situation - Ocean
- Shipping rates have declined significantly due to reduced demand caused by high inflation and the cost-of-living crisis. Although consumer demand improved in January 2023, demand was comparatively lower.
- Spot market pricing continues to be low as volumes gradually decrease. The consistently low spot rates will eventually push several smaller carriers out of the market, balancing the current surplus of capacity and driving up rates once again.
- Average daily rates from Asia to the U.S. West Coast across the Pacific stand at around roughly $1,500 per 40-foot container, compared with more than $14,000 last year.
- The fall in charge is attributed mainly to the volume of ships competing for cargo, driving prices downwards.
- The rates are hovering around 2019 levels; however, fuel and labor expenses are higher now than before the pandemic.
- Ship operators are concerned that low freight rates are causing challenges in managing their operating costs.
Pricing Situation - Ground
- Diesel prices in the first quarter of 2023 have shown a downward trajectory.
- The freight rates for LTL, TL, and IM continue to decline, including declines in diesel prices over the past quarter, leading to improved trucking availability.
- Weak pricing for the rest of the 2023 parcel-delivery season will give way to 6%-%10% increases in base rates and accessorials charges in 2024.
- Centerm (Vancouver) has implemented a $68 gate fee for daytime pulls and $18 for night transactions as of 6/1
- According to estimates, warehouse rents will remain high in 2023 and increase at a slower rate; with rents growing by 10% in the United States in 2023.
- The demand for industrial space on the U.S. East Coast is rising due to a shortage of space as more supply chains are rerouted through eastern ports.
EUROPE
Market Overview - Air
- With the introduction of airlines’ summer schedules, we are seeing increasing capacity out of Asia, Europe and the Americas
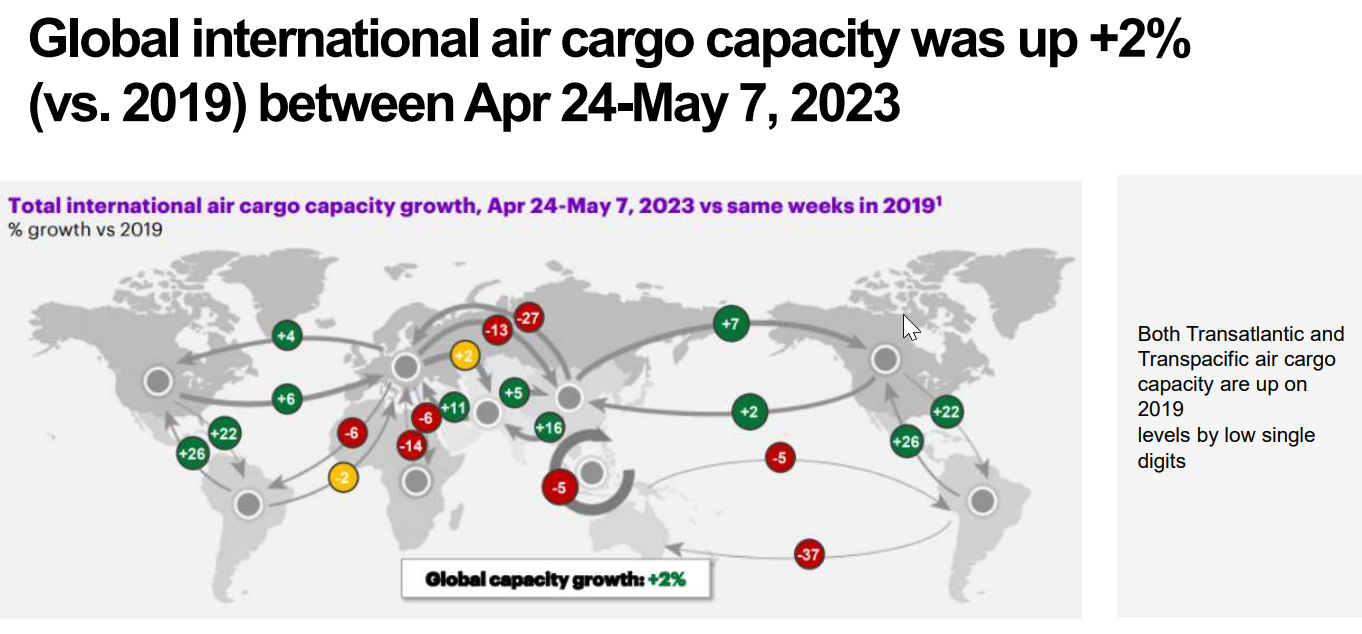
- Global international cargo capacity is up 2% versus 2019
- The outlook for the air freight market continues to be poor, with a potential recovery unlikely before the end of this year, if not Q1 next year.
- The green fuels law for aviation–known as ReFuelEU–stipulate that as of 2025, all flights departing from an EU airport will be obliged to uplift a minimum share of sustainable aviation fuels (SAF), starting at 2% in 2025. In 2030, the percentage will rise to 6% and gradually to 70% by 2050.
- With the introduction of airlines’ summer schedules, we are seeing increasing capacity out of Asia, Europe and the Americas
- Global international cargo capacity is up 2% versus 2019
- The outlook for the air freight market continues to be poor, with a potential recovery unlikely before the end of this year, if not Q1 next year.
- The green fuels law for aviation–known as ReFuelEU–stipulate that as of 2025, all flights departing from an EU airport will be obliged to uplift a minimum share of sustainable aviation fuels (SAF), starting at 2% in 2025. In 2030, the percentage will rise to 6% and gradually to 70% by 2050.
Market Overview - Ocean
- The consensus is that not only have spot markets stabilized, but they have likely reached the bottom or are very close to it.
- Seaborne container trade volumes decreased by 3.7% in 2022.
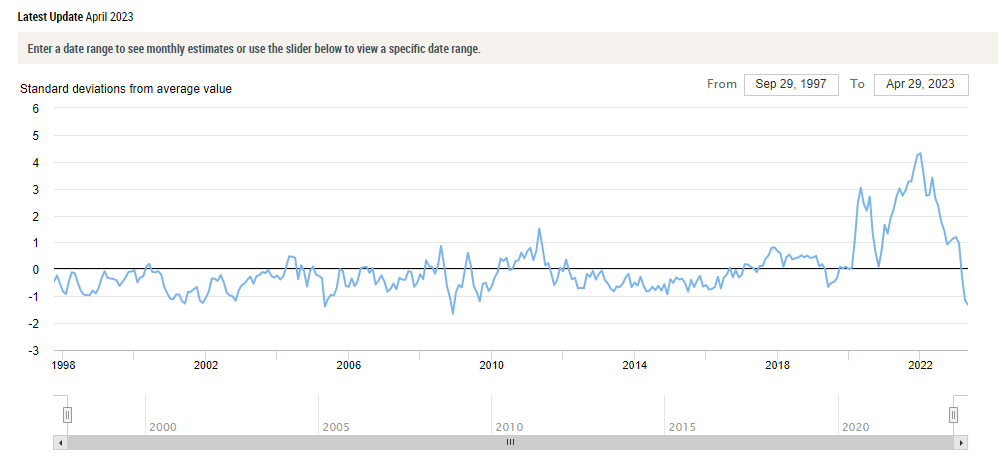
- As per the Global Supply Chain Pressure Index (GSCPI), global supply chain pressures decreased again in April, falling to 1.32 standard deviations below the index's historical average.
- There were several factors contributing to the decline, including delivery times and backlogs in the European area.
- As indicated by the GSCPI's recent movements (see graph below), global supply chain conditions have largely normalized following temporary setbacks near the beginning of the year.
- 1,200 supply chain professionals were surveyed by Container xChange regarding disruptions with the potential to impact the shipping industry in 2023.
- A recession in the United States was cited by 49% of respondents as one of the top concerns for the freight industry, followed by geopolitical tensions at 32% and rising operating costs at 22%.
Market Overview - Ground
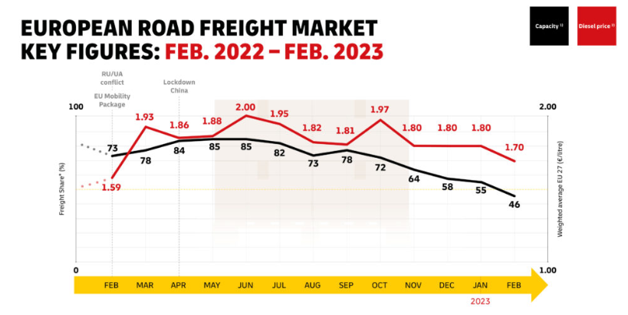
- On average, Q1 2023 diesel prices were 9% less expensive than Q4 2022 levels and trending closer to Jan 2022 levels, i.e., before the start of the war in Ukraine.
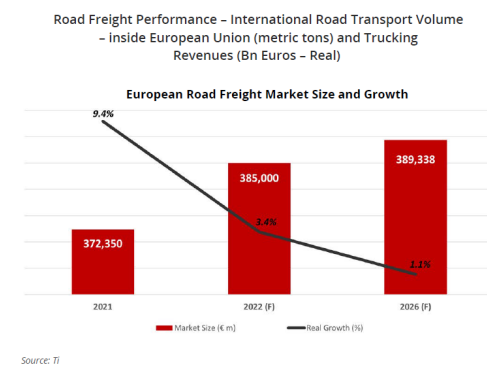
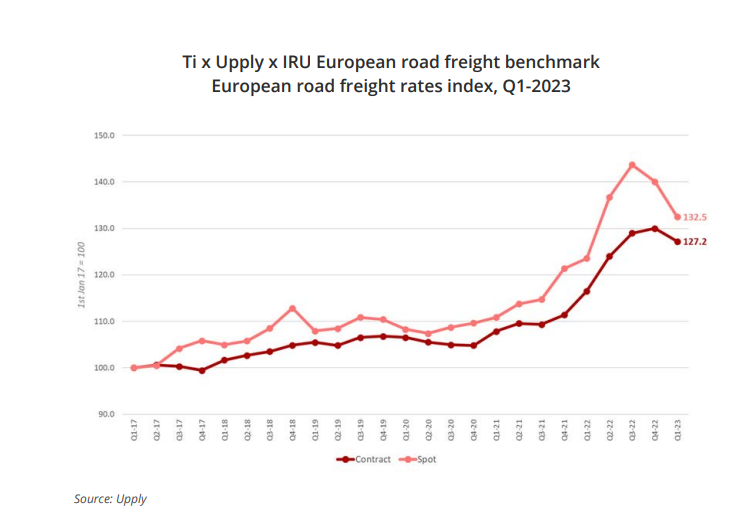
- Spot rates in the European road freight market have experienced their second consecutive quarter of decline but remain significantly higher than 2019 pricing.
- Driver shortages continue to be an issue.
Demand Commentary - Air
- The attractiveness of airfreight versus ocean freight continues to deteriorate on most major trade lanes.
- This is not only due to the continuing decline in ocean freight rates but also due to improvements in ocean schedule reliability and more readily available capacity.
- Currently, around a quarter of freight capacity out of China is on passenger flights, compared to 45% in April 2019.
- However, the increase in capacity is unlikely to be met by a similar increase in demand, leading to lower filling factors and lower rates.
Demand Commentary - Ocean
- Overall, the demand for the Transpacific remains weak, while the demand for Asia-Europe appears to have improved. On many trade lanes, the spot rate indices are low and likely to be at loss-making levels.
- There was a decline of 20-30% in Asia-Europe demand in the autumn of 2022, but the demand has since strengthened back to its previous peak levels.
- JP Morgan estimates that the total fleet size will grow at 1% m/m for the remainder of 2023 and into 2024, with circa 20% to be added across each year.
- Demand may improve by 5% from its current level per their report. Fully offsetting the remaining 15% with slow steaming and scrapping seems challenging.
- CTS has released its latest data for March 2022, and it shows that global demand declined 2.9% in March but remains up compared to pre-pandemic levels.
Demand Commentary - Ground
- Despite some easing of inflation and quarter-over-quarter (Q/Q) growth in seasonally adjusted monthly consumption figures in Spain (+1.0%), France (+0.4%), and the UK (+0.5%), year-on-year figures reflect the ongoing impact of persistent inflation over the past 12 months.
- Average seasonally adjusted monthly consumption is down year-on-year by 6% in Germany, 3.9% in France, 2.8% in Italy, 4.3% in the UK, and 14.5% in the Czech Republic.
- As wage growth lags inflation, the cost-of-living crisis worsens, reducing the appetite and ability to consume goods.
- This will further reduce demand-side pressure on the road freight market, allowing for further rate falls in both markets.
- Although fears of an energy crisis have subsided and energy prices have fallen, last year's high prices continue to act as a drag on Europe's industrial growth.
- Available Q1 2023 data from official sources reveal a decline in production in the UK (-0.5%), Spain (0.3%), and Poland (-0.1%), while production in France (+0.9%) and Germany (+0.5%) has grown.
- Inflation is eroding the demand for consumer goods, while demand for capital and intermediate goods remains steady.
Supply Commentary - Air
- The start of airlines’ summer schedules has resulted in a large increase in capacity on many trades. For example, capacity out of Europe is now up by 20% compared to a year ago, and out of the US, it is up by 11%.
- Capacity out of China is expected to continue increasing, with both passenger and cargo airlines adding more in- and outbound connections. Currently, around a quarter of freight capacity out of China is on passenger flights, compared to 45% in April 2019.
- However, the increase in capacity is unlikely to be met by a similar increase in demand, leading to lower filling factors and lower rates.
- This is also the case in other major trades, such as the trans-Atlantic where the higher capacity from airlines’ summer schedules is unlikely to be filled as demand remains subdued.
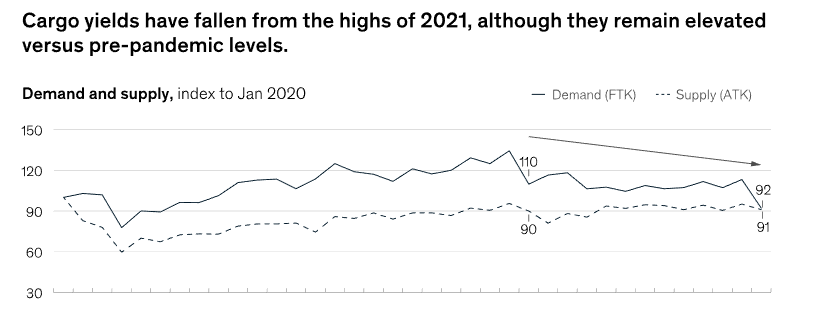
- Cargo airlines enjoyed a period of high revenue—driven by scarce capacity—during the pandemic. But after the boom of the past three years, yields are gradually falling from the 2021 peak.
- Belly cargo capacity is recovering, and demand is softening, leading to uncertainty as cargo airlines brace for the risk of a “back to normal” scenario.
Supply Commentary - Ocean
- Fleet utilization in the first four months weakened as the container fleet expanded by 1.3%, while easing port congestion also added around 3-4% to the active capacity.
- Through early May, the global inactive container ship fleet continued to shrink, albeit at a slower rate than in the second half of April. According to Alphaliner's most recent survey, on 8 May, there were 263 inactive ships with a total capacity of 1,099,678 teu. The figure represents 4.2% of the global cellular fleet, a very slight decrease from the 4.4% recorded in late April.
- The order book is at a historical high of 7.5 million teus (29% of the fleet)
- Scrapping was low, with 11 vessels sold in 22. In the first four months of 2023, 19 vessels were demolished. Unless the pace of this market picks up, carriers will have excess capacity on most major routes.
- A strong demand for container charters across most sizes continues to be apparent in the container charter market. The demand for larger vessels has been particularly strong of late.
- It is estimated that capacity across Transpacific, Asia-Europe, and Transatlantic is 12% below its recent peak in June 2022. Recently, capacity has been added to the Asia-Europe trade lane, but transpacific capacity remains near the bottom, as demand remains weak.
- In March 2023, global schedule reliability increased by 2.4 percentage points, reaching 62.6%, almost matching the 2020 figure. In terms of Y/Y comparisons, schedule reliability increased by 26.8 percentage points.
Supply Commentary - Ground
- According to the last IRU survey, the shortage of truck drivers in Europe is forecasted to remain high with 9% of driver positions in 2023, reaching at least 300,000 unfilled jobs. The share of women and young truck drivers remains low, representing respectively 4% and 8% of the truck driver’s workforce.
- The stagnation in freight demand from Q4 2022 has continued into 2023, flattening the driver shortage curve – for now. Per IRU senior director for strategy and development, Vincent Erard, "nothing has changed in the long-term outlook of the profession.
- The share of young drivers remains extremely low. Any jump in demand from European economies will further exacerbate the shortage of drivers, which in turn will limit economic growth. We can’t take our eye off the ball. We need to continue pushing for both immediate and structural solutions to driver shortages.”
Pricing Situation - Air
- Air Rates are still falling slowly and there was a slight increase around the May 1st holidays in Asia and Europe but within a week the price had fallen back down to pre-holiday levels.
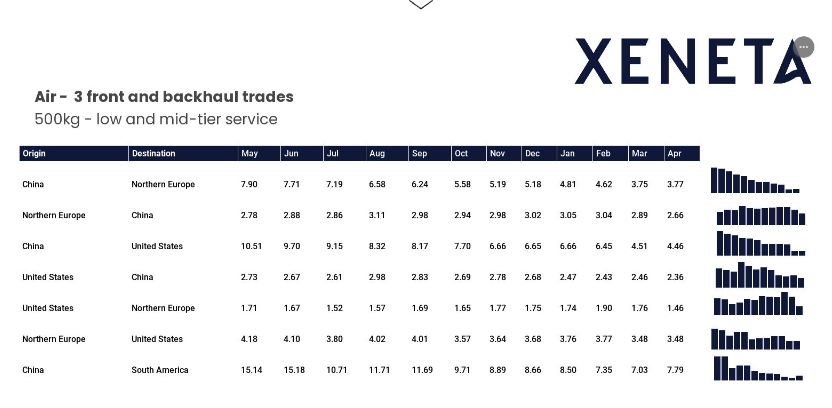
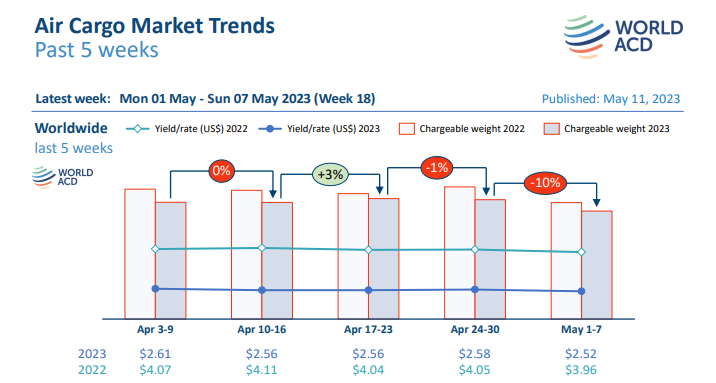
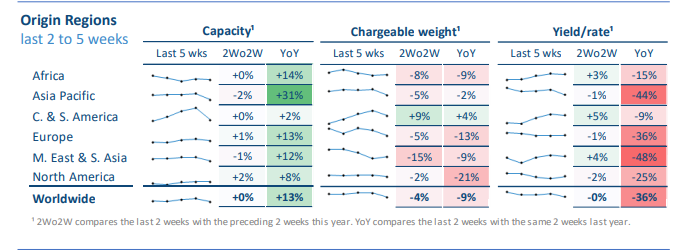
- Worldwide rates are currently -36% below their levels this time last year, at an average of USD 2.52 per kilo in week 18, despite the effects of higher fuel surcharges, although they remain significantly above pre-COVID levels.
- Looking purely on a freight rate basis, and using a set of fixed assumptions, Xeneta has carried out the following analysis:
- From the Far East to North Europe current air freight prices are around 25 times higher, per kg., than equivalent ocean freight.
- This is almost five times the ratio seen back in September 2021, when ocean spot rates sky-rocketed and made air freight a relatively less expensive option, with better reliability.
Pricing Situation - Ocean
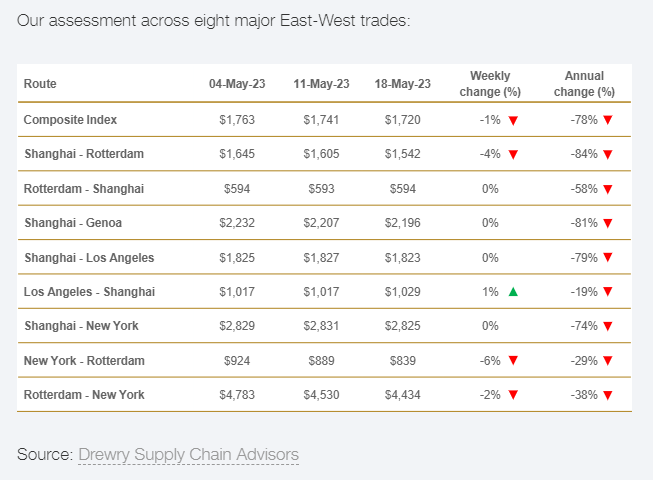
- Drewry’s composite World Container Index decreased by 2% to $1,685.32 per 40ft container on the 25th of May and is 78% lower than the same week in 2022.
- Freight rates on Rotterdam – New York fell a massive 10% or $465 to $3,969 per feu.
- Rates on Shanghai – Genoa and Shanghai – Rotterdam dropped to $2,169 and $1,530 per 40ft container, respectively.
- Drewry expects East-West spot rates on routes other than the transatlantic to be stable in the next few weeks.
- SCFI steadied w-o-w as demand remains weak; resilient consumption lends hope for 2H restocking-led volume recovery.
- Several container carriers have locked in Asia-Europe contracts at higher levels (negotiated in late 2022), and Transpacific contracts are also being negotiated above spot rates.
Pricing Situation - Ground
- Despite the easing of demand-side pressure, supply pressures remain.
- A worsening driver shortage is eroding capacity, while fuel costs have fallen from their 2022 high, they remain elevated compared to 2021.
- The cost-of-living crisis across the continent is also increasing wage demands in 2023, resulting in labor cost increases.
- The likely result is further freight rate declines from softening demand. However, the size and scope of these declines will be limited by supply-side pressures that have created a higher cost base, thereby preventing freight rates from reaching historic lows.
Supply Analysis - Air
- Since late last year, air logistics executives had high hopes that the protracted downturn in shipping demand would start to recover after the first quarter and build through the year once retailers cleared out their excess inventories. That wishful thinking is fading.
- Current indicators suggest that the international freight recession has not yet hit bottom and that the best outcome air cargo providers can hope for is halting the slide.
- The growing risk of recession, ongoing excess inventory and the injection of additional capacity—as airlines return passenger aircraft to post-pandemic summer service—means that bookings and rates will continue to suffer for months.
- Currently, the ocean market is difficult to read which has led to many shippers postponing sharing capacity commitments.
- Overall, due to complex and ambiguous signals, market direction is difficult to gauge currently.
Supply Analysis - Ground
- Freight rates are expected to continue to soften in Q2 2023 but will remain elevated in comparison to historic norms as supply-side pressure keeps costs high. Towards the end of the year, volumes are expected to start recovering, applying upward pressure on rates
Back to Top