

By clicking the “I Accept” button, or by accessing, participating, or submitting any information, or using the Jabil Global Intelligence Portal or any of its associated software, you warrant that you are duly authorized to accept the Global Intelligence Portal Terms and Conditions on behalf of your Company, intending to be legally bound hereby, and your company shall be bound by the terms and provisions of the Global Intelligence Portal Terms and Conditions, accessible under the following link Portal T&Cs.
Jabil's Global Category Intelligence Archive
Global Category Intelligence
Q3 2023
Jabil's Global Category Intelligence Archive
Global Category Intelligence
Q3 2023
ENERGY
ENERGY
Market Overview
- Global energy supply has witnessed a rise over the last 3 months when compared with supply trends over the previous 18 months. The compelling reason for this increase is due to the record warm temperatures in winter. This warm weather resulted in less demand over the winter and allowed the gas storage levels to increase significantly above the levels seen in the past 18 months.
- Pricing across Europe has taken a significant downturn in comparison to the pricing seen last year and the volatility has also decreased significantly. The dominating reason for this is the increase in gas storage levels and increased certainty regarding future supply, given the current issues with Russia and the EU.
- Low-emissions sources are set to cover almost all the growth in global electricity demand by 2025. This is a huge step forward for the renewable sector with renewables and nuclear energy will dominate the growth of global electricity supply over the next three years, together meeting on average more than 90% of the additional demand. China accounts for more than 45% of the growth in renewable generation in the period 2023-2025, followed by the EU with 15%
- This transition is sustained by lower costs – in most markets, solar PV and wind now represent the cheapest available sources of new electricity generation. These changes are progressively forcing industries to change their energy spending habits to gain value in the market and act against geopolitical market volatility.
- Over the outlook period, global electricity demand is set to grow at an accelerated pace, by an annualized 3%, as electricity consumption increases in emerging markets and developing economies (EMDEs), led by the People’s Republic of China (hereafter “China”), India and Southeast Asia.
Demand Commentary
Asia Pacific
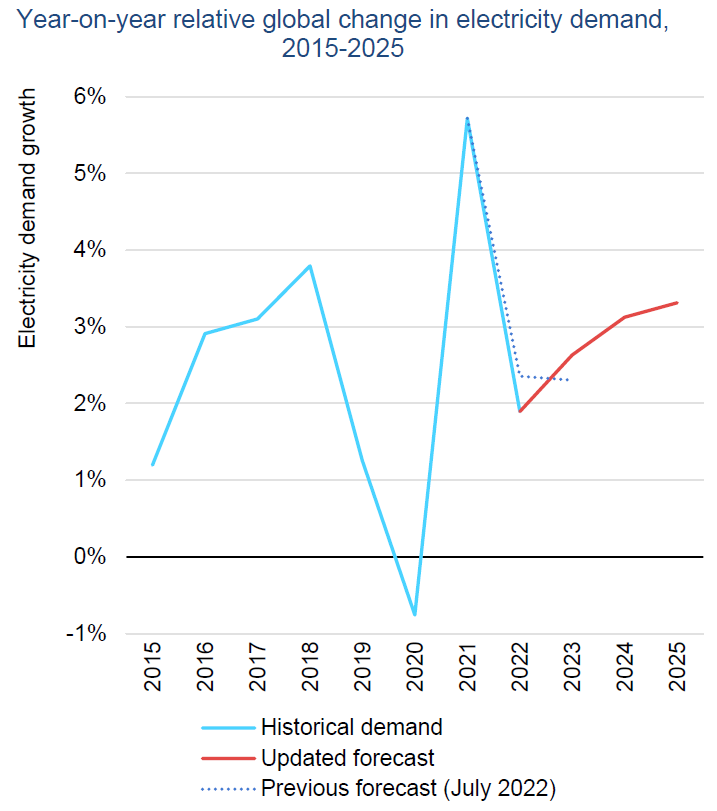
- Global electricity demand growth eased in 2022 but is set to accelerate from 2023, led by Asia.
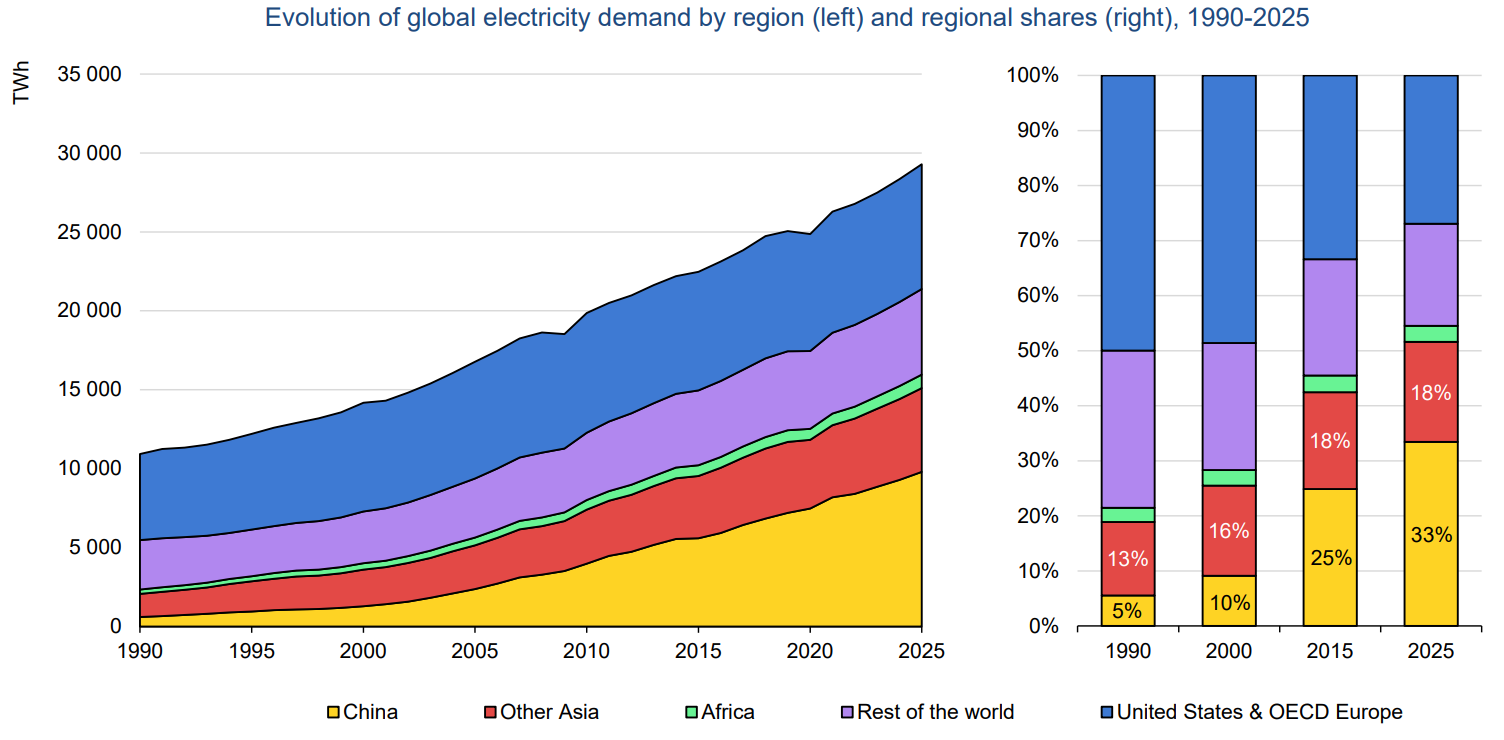
- By 2025, for the first time in history, Asia will account for half of the world’s electricity consumption and one-third of global electricity will be consumed in China.
- As the energy crisis remains, global electricity demand growth is set to rise from 2.6% in 2023 to an average of 3.2% in 2024-2025.
- This stronger growth is well above the pre-pandemic rate of 2.4% observed in the 2015-2019 period.
- Indeed, by 2025 demand will increase by 2 500 TWh from 2022 levels, which means that over the next three years, the electricity consumption added each year is roughly equivalent to that of the United Kingdom and Germany combined.
- More than half of the increase will come from China. The remaining growth will largely take place in India and Southeast Asia.
- In China, electricity demand growth was subdued by weaker economic activity in 2022, rising at an estimated 2.6%, and significantly below its trend of 5.4% in 2015-2019 (https://www.iea.org/reports/electricity-market-report-2023).
- China is by far the world’s largest electricity consumer at 31% of global demand in 2022. For 2023-2025 we expect an average annual growth of 5.2%.
- In India, the robust post-pandemic recovery continued to support strong electricity demand of over 8.4% in 2022, which was substantially higher than the average annual growth rate of 5.3% seen in the 2015-2019 period.
- The peak summer season also arrived early in 2022, resulting in the hottest March in over a century. Electricity demand from March to July was 12% higher than the same period in 2021.
- For the 2023-2025 period, we expect slightly slower growth, averaging 5.6% per year.
Out to 2025, more than 70% of the growth in global electricity demand is set to come from China, India, and Southeast Asia combined
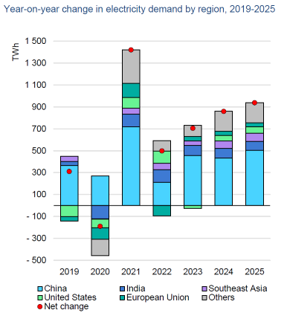
Source: IEA ElectricityMarketReport2023
Demand Commentary
Europe
- Electricity demand in the European Union (EU) fell 3.5% in 2022, with spiking electricity prices, demand destruction in electricity-intensive industries, energy-saving measures and a mild winter all contributing to the decline. We expect EU demand to grow by around 1.4% on average in 2023-2025.
- The energy crisis sparked by Russia’s invasion of Ukraine has been characterized by record-high commodity prices, weaker economic growth, and high inflation. Higher fuel prices increased the cost of electricity generation around the world, putting downward pressure on consumption in many regions. Despite the worsening crisis, global electricity demand remained relatively resilient, growing by almost 2% in 2022. This affected the European region more than any other globally, given their reliance on Russian energy for the region's demand.
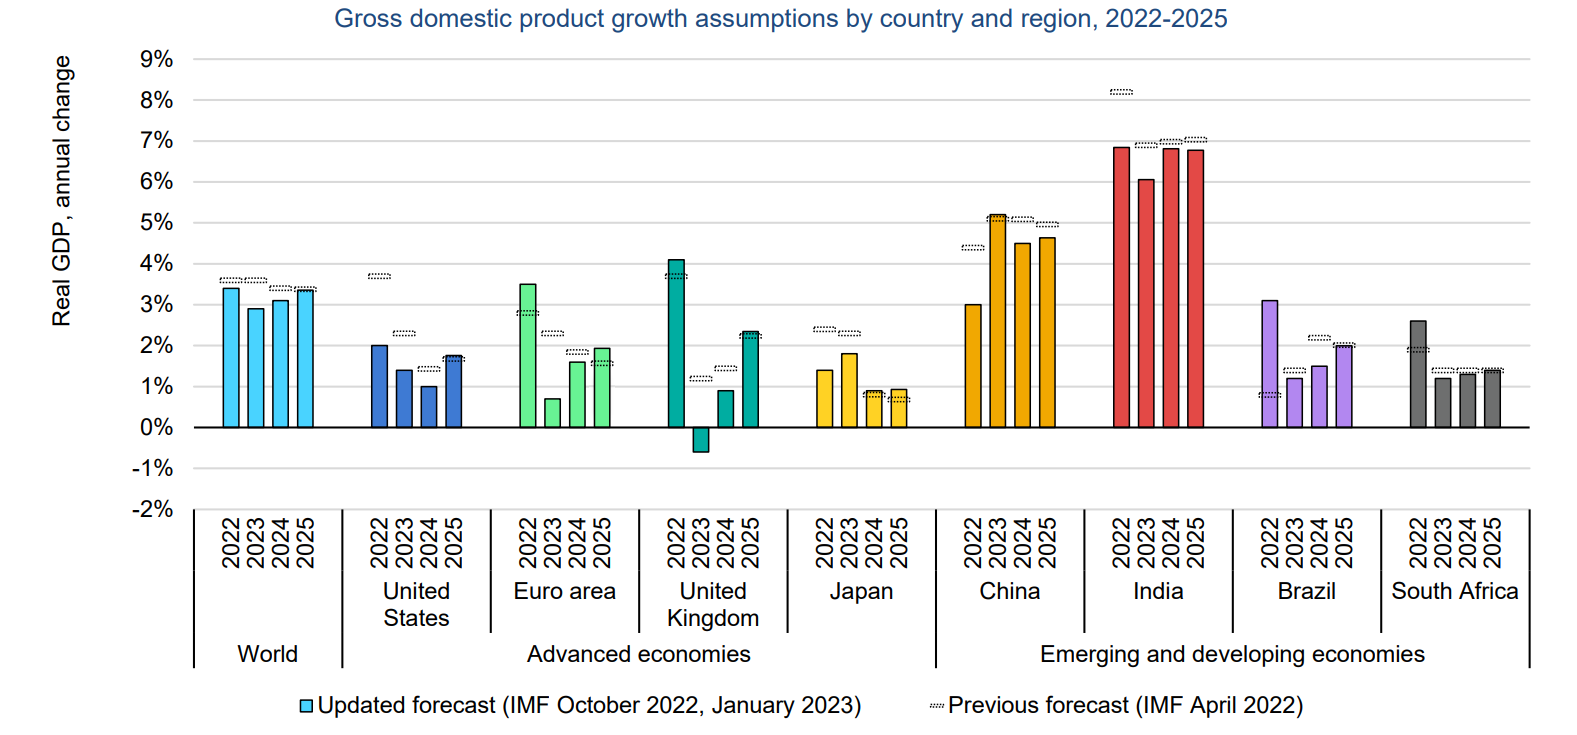
Notes: The bars represent annual changes in GDP relative to the previous year. The hollow lines show the previous April 2022 forecast. 2022-2024 values are from the January 2023 World Economic Outlook Update of the International Monetary Fund (IMF).
Sources: IEA ElectricityMarketReport 2023. Based on International Monetary Fund (2023), World Economic Outlook October 2022 Database, World Economic Outlook Update January 2023, 1 February 2023.
Demand Commentary
Americas & Rest of World
- In the United States, electricity demand rose by 2.6% in 2022, surpassing pre-Covid levels. But an expected economic slowdown in 2023 is expected to lead to a decline of about 0.6%, before returning to growth of 1.2% in 2024 and 1.3% in 2025.
- The economic slowdown at the beginning of 2023 has not been as significant as expected in late 2022 but is still consistent with the above statement.
- In Africa, electricity demand rose by 1.5% in 2022, with growth tempered by both lofty energy prices and high inflation rates.
- Our 2023-2025 outlook for the region shows much stronger growth of an average of 4.1%, led by a post-crisis economic recovery.
Supply Commentary
- Power systems faced challenges in multiple regions in 2022 due to extreme weather events. Heatwaves and droughts strained the supply situation in both China and India.
- A historic drought in Europe resulted in low hydropower output, putting increased pressure on dispatchable capacities amid record-low nuclear generation in France.
- In the United States, winter storms caused widespread power outages. These extreme events reinforce the urgent need to increase the flexibility of the power system and enhance the security of the electricity supply to better cope with weather-related contingencies.
- The global energy supply is largely affected by macro weather conditions as this defines the demand whilst also directly affecting power generation sources.
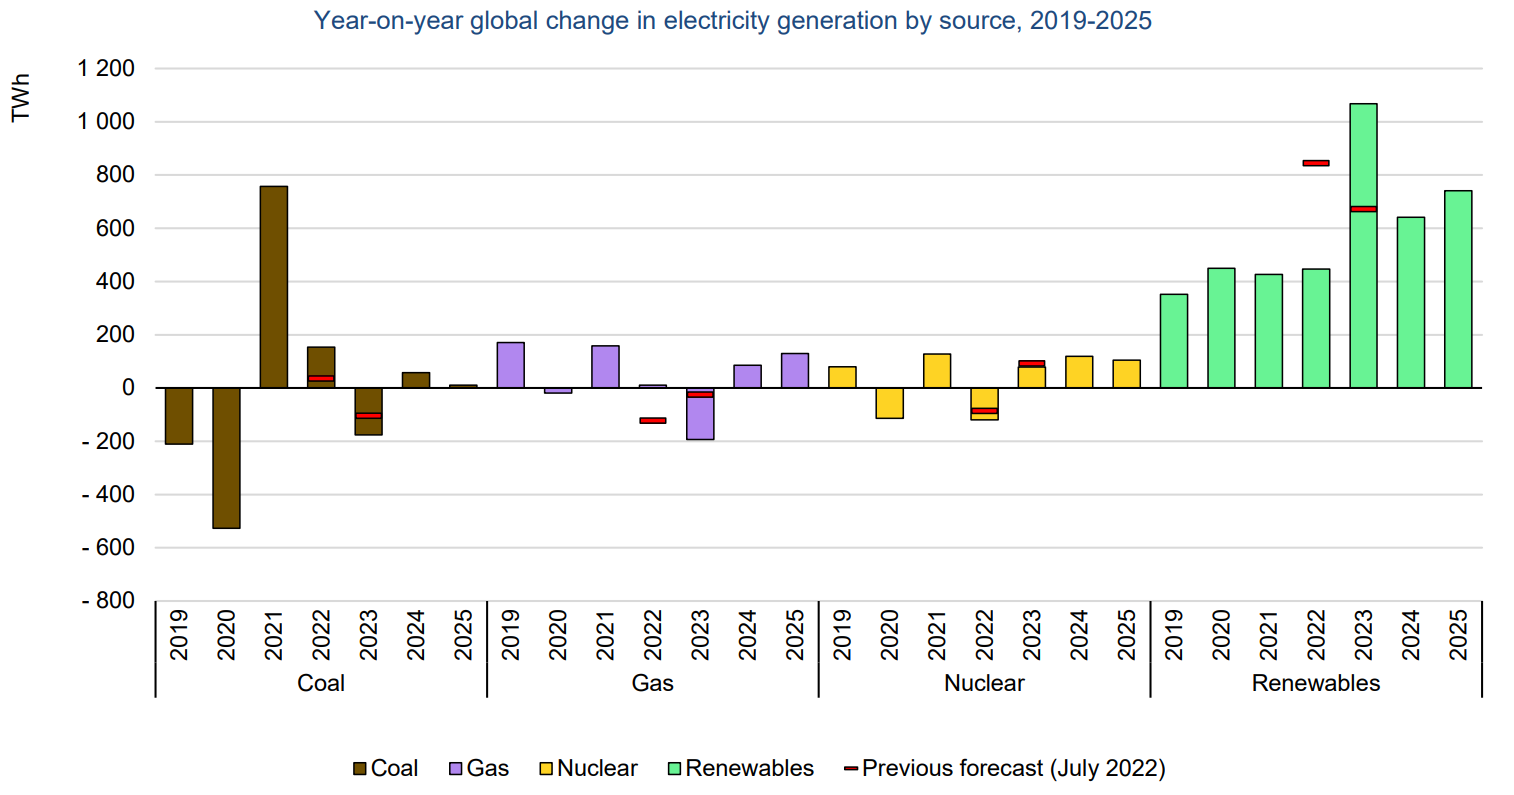
- In 2022, the surge in fossil fuel prices following Russia’s invasion of Ukraine also compounded the supply situation, especially for gas. The relatively higher increase in natural gas and LNG prices prompted a wave of fuel switching in the world to coal for use in power generation. Global coal-fired generation rose by 1.5% in 2022, with the largest absolute increases in the Asia Pacific region.
- Coal-fired generation also rose significantly in the European Union amid low hydro and nuclear output. However, 2022 is likely to be an exception, and global coal-fired generation is forecast to plateau in 2023-2025, as higher output in the Asia Pacific region is offset by declines in Europe and the Americas.
- Global gas-fired generation remained relatively unchanged in 2022 compared to 2021, as declines in China, India, and other regions were largely offset by a rise in gas-fired output in the United States.
- We expect global gas-fired generation to stagnate until 2025 on average, after declining by 3% in 2023, then growing by 1.4% in 2024 and 2% in 2025. Substantial declines in the EU will partly be offset by significant growth in the Middle East.
- Low-carbon generation from renewables and nuclear had diverging trends in 2022. Renewables saw a year-on-year rise of 5.7%, making up almost 30% of the generation mix. A surge in renewable generation in the Asia Pacific region accounted for more than half of the increase, followed by the Americas. By contrast, nuclear output fell 4.3%. This was due to maintenance outages at many French plants, decommissioning of units in Germany and Belgium, and reduced Ukrainian output.
- In general, these plants are being decommissioned due to their age and need for replacement to ensure safety.
- Our outlook for 2023 to 2025 shows that renewable power generation is set to increase more than all other sources combined, with an annualized growth of over 9%. Renewables will make up over one-third of the global generation mix by 2025.
- This trend is supported by government pledges to increase spending on renewables as part of economic recovery plans such as the Inflation Reduction Act in the United States.
- Global energy supply commentary by the data:
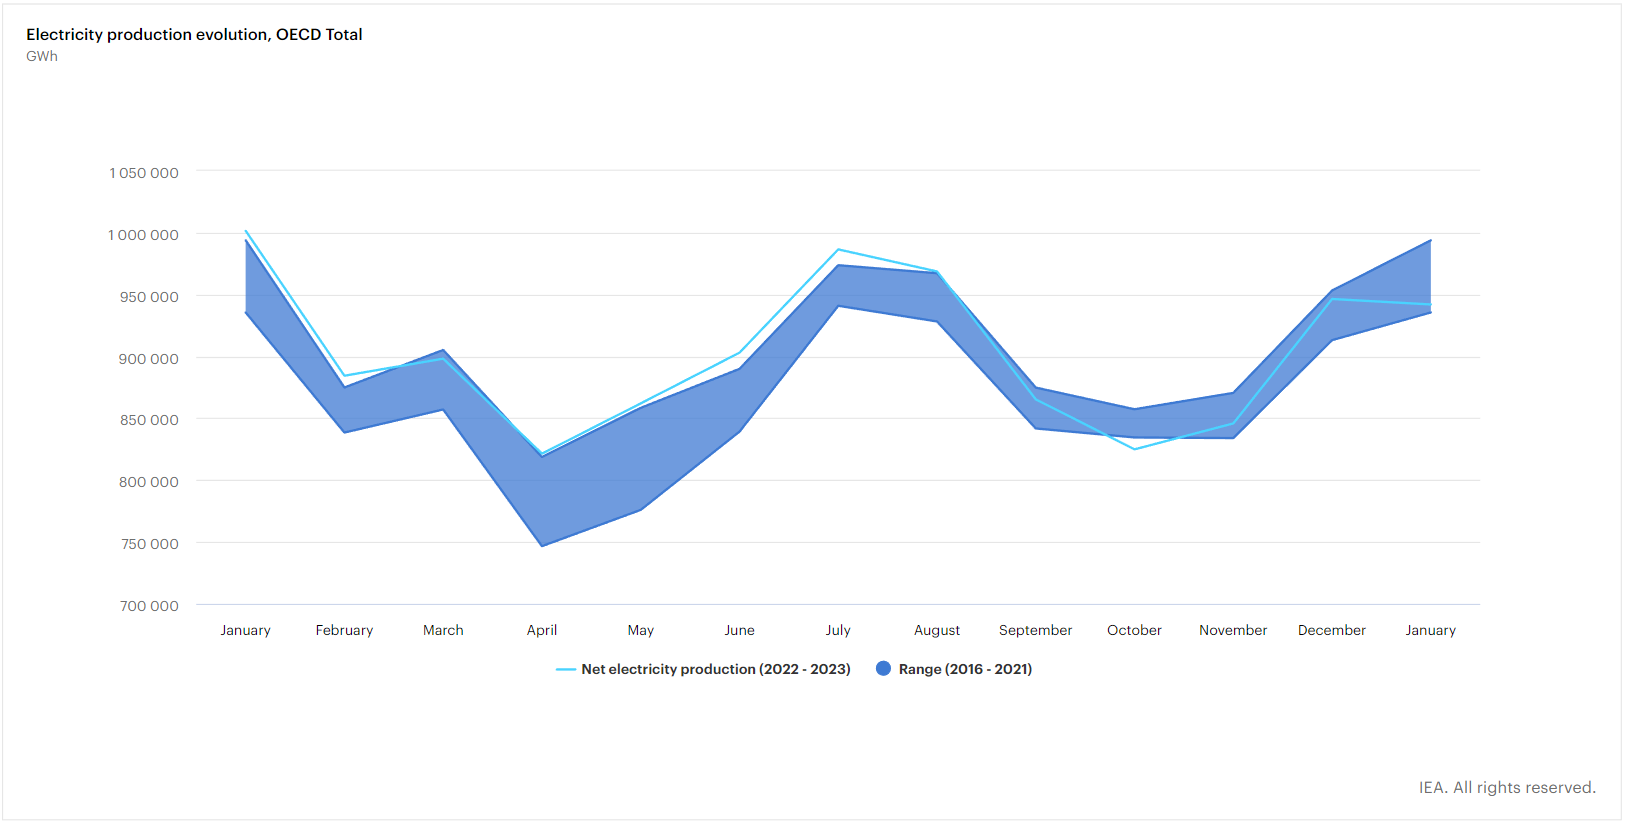
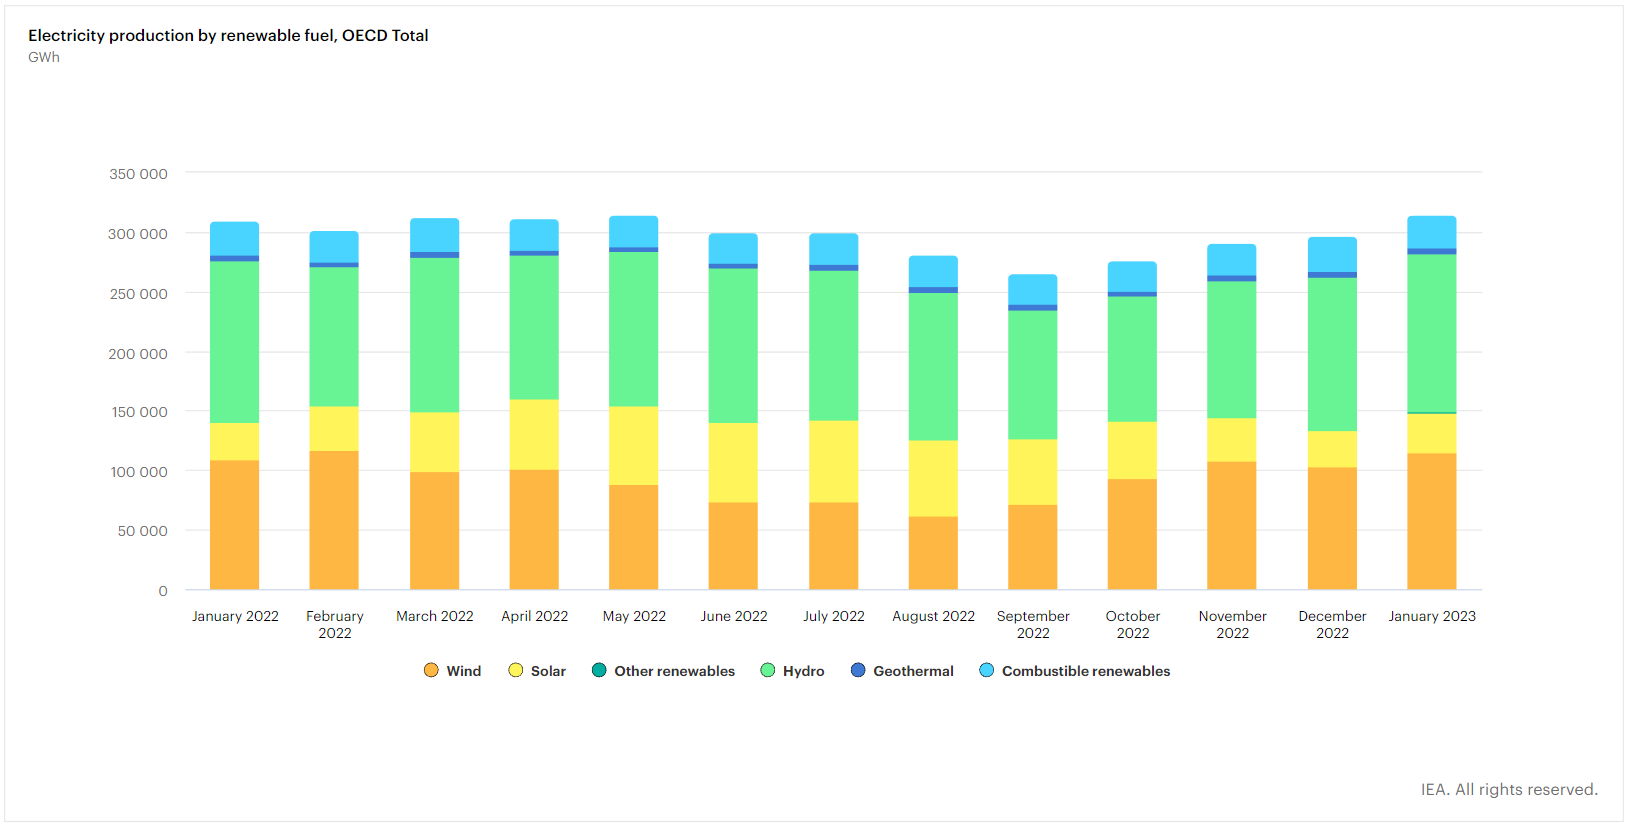
- In the OECD, total net electricity production amounted to 941.9 TWh in January 2023, down by 5.9% year-on-year1 compared to January 2022.
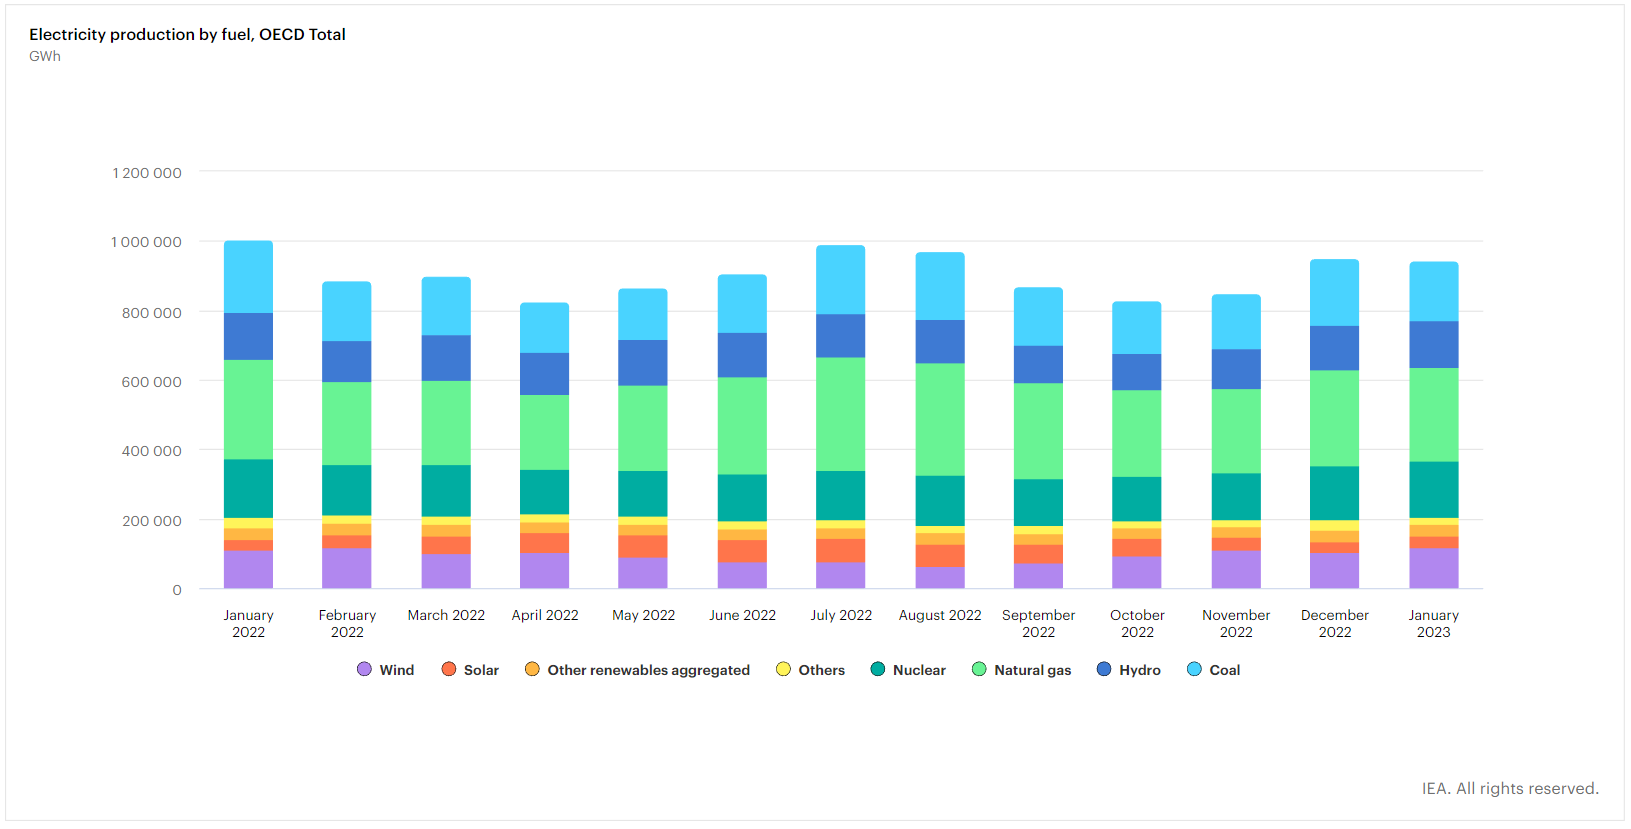
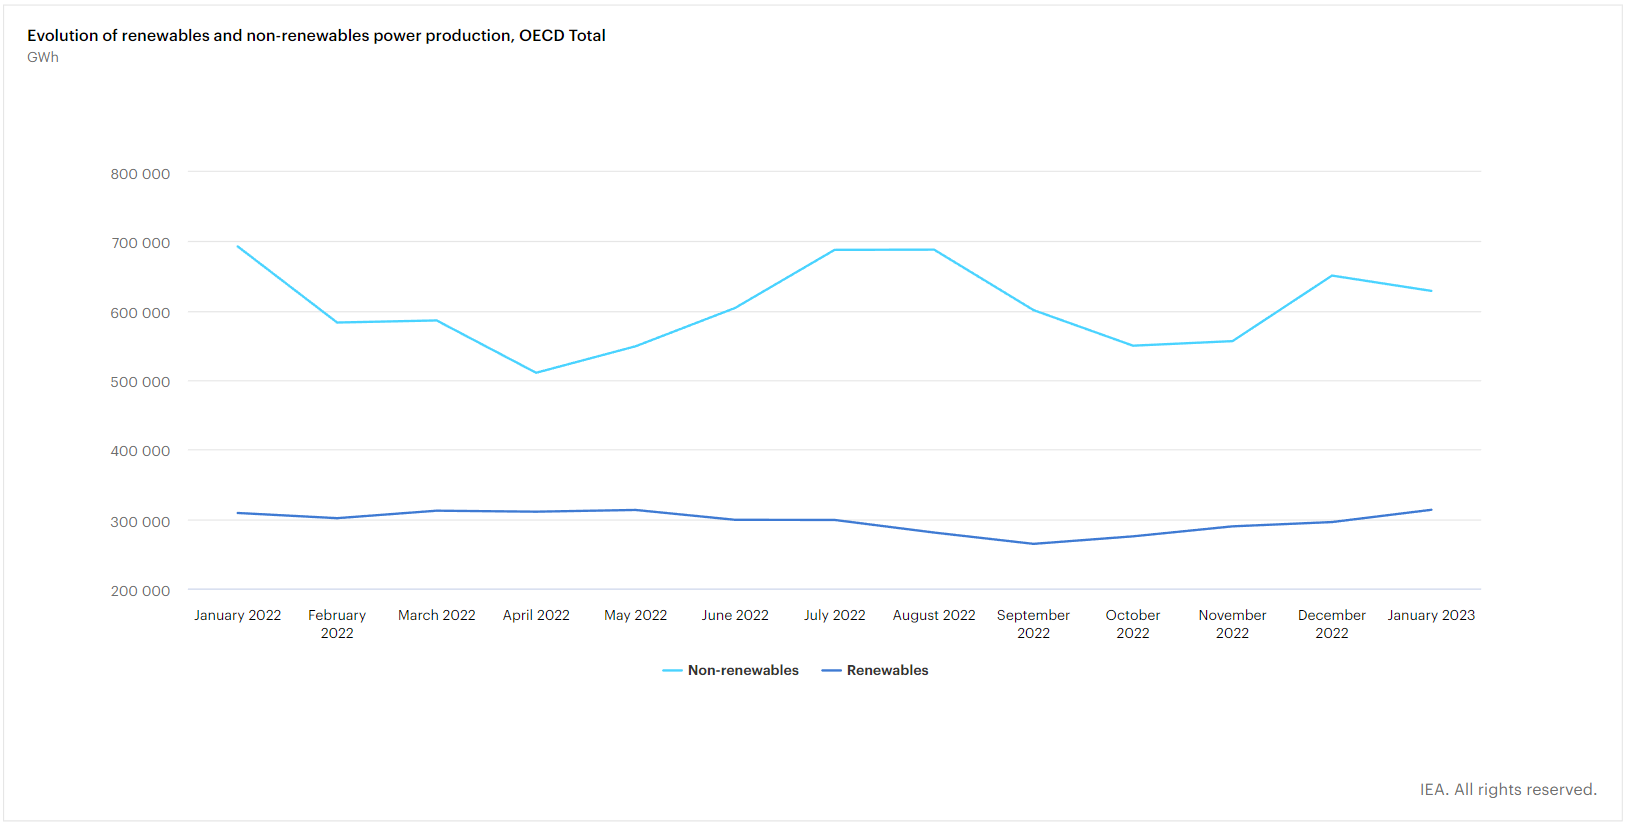
- Electricity production from renewables went up by 1.6% year-on-year to 313.4 TWh in January 2023, driven by strong wind (+5.5% y-o-y or 5.9 TWh) and solar (+7.7% y-o-y or 2.4 TWh) output. This growth couldn’t compensate for the negative trend witnessed by fossil fuels, amounting to a loss of 56.8 TWh (-10.9% year-to-date2) compared to 2022.
- Electricity production from coal fell by -16.4% y-o-y or 34.1 TWh, essentially driven by lower output in the OECD Americas (-29.8% y-o-y) and in OECD Europe (-10.2% y-o-y), while in OECD Asia-Oceania production slightly increased (+0.9% y-o-y).
- Electricity production from natural gas went down by 5.5% y-o-y or 15.6 TWh, with OECD Europe being the main contributor to this drop (-22.3% y-o-y or 16.1 TWh). Nuclear electricity production in the OECD decreased by 4.3% y-o-y or 7.3 TWh in January 2023, mainly because of reduced nuclear output in the OECD Europe region (-10.0% y-o-y or 6.7 TWh).
Pricing Situation
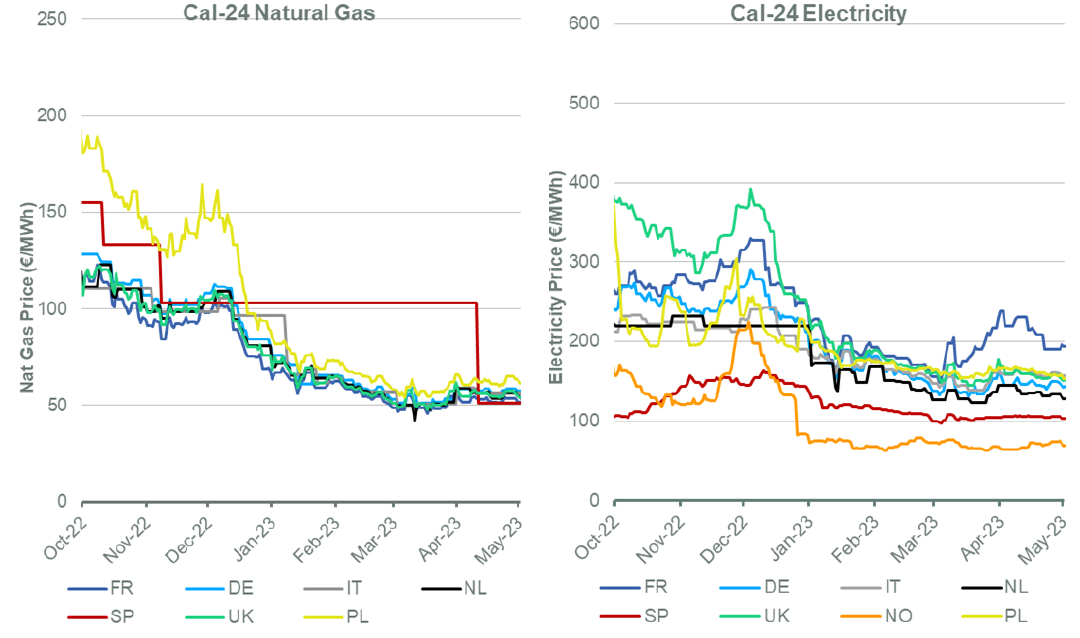
- Global electricity pricing has stabilized significantly since the madness that was experienced in 2022 which shocked global markets. Deregulated regions and countries have been experiencing bearish markets since the beginning of 2023.
- Europe was impacted the greatest by the Russia-Ukraine war due to its proximity and reliance on Russian oil and gas. In solidarity with Ukraine, the European Union (EU) initiated an embargo on imports of Russian energy, leaving the region with a significant deficit in supply, hence, the pricing skyrocketed.
- 2023 pricing across Europe has been steadily decreasing since January 2023 – largely driven by the high gas reserves across the region, given the record warm winter experienced last winter.
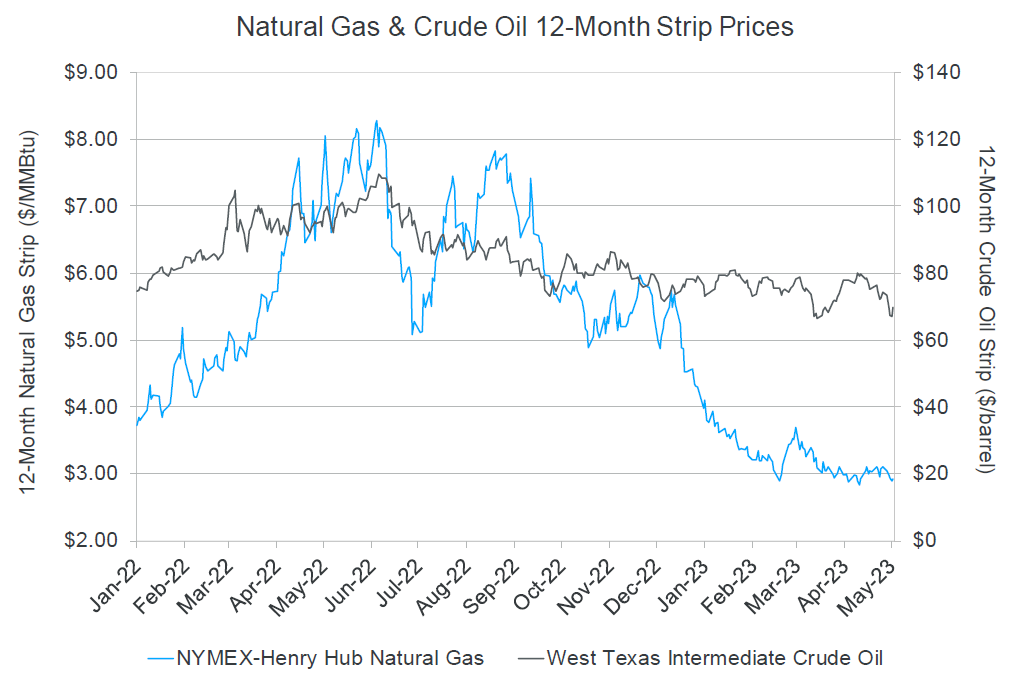
- In the United States, the trend for the price on the Henry Hub Natural Gas market has been decreasing sharply since January 2023 and has now begun to stabilize since April 2023.
- The West Texas Intermediate Crude oil index has been relatively consistent over the past 6 months with a gradual downward price trend over this time.
- Both markets show strong indications that the pricing is returning to more normality, and we are currently in a bearish market.
Key Takeaways
- Energy market volatility has been reducing consistently over the past quarter given the increase in supply globally, however, as a commodity it remains very prone to dramatic changes in weather or geopolitics which can change the global markets significantly in a short period of time.
- Renewables are growing faster than demand to reduce dependency on fossil fuels. This is being accelerated with the increasing action governments are taking to reduce fossil fuel emissions and offer more support for renewable solutions.
- Large uncertainties for 2023 still remain. The main uncertainties affecting our 2023 forecasts for electricity demand, generation mix, and price concern fossil fuel supply and economic growth, combined with political pressure to transition over to renewable energy sources.
- Electricity in Europe stabilized more in Q2 of 2023 with a significant decrease in pricing.
- Advice would be to:
- Investigate if there are any alternative options available that could benefit the business to either reduce consumption.
- Implement a longer-term energy strategy to create long-term benefits that will reduce exposure to market volatility. Examples include a staged strategy with a combination of purchasing RECs, on-site energy generation, off-site energy generation, PPA, and VPPA.
- Ensure that the risk being exposed to is manageable. If it is not, fix pricing where possible to mitigate unmanageable risk.
- Now is a good time to investigate locking contracts as the price for energy has significantly dipped since Q3 and Q4 2022 and has now stabilized.
Back to Top