

By clicking the “I Accept” button, or by accessing, participating, or submitting any information, or using the Jabil Global Intelligence Portal or any of its associated software, you warrant that you are duly authorized to accept the Global Intelligence Portal Terms and Conditions on behalf of your Company, intending to be legally bound hereby, and your company shall be bound by the terms and provisions of the Global Intelligence Portal Terms and Conditions, accessible under the following link Portal T&Cs.
Jabil's Global Category Intelligence Archive
Global Category Intelligence
Q4 2024
Jabil's Global Category Intelligence Archive
Global Category Intelligence
Q4 2024
GLOBAL LOGISTICS
Asia
MARKET DYNAMICS
-
The global air cargo market continues to grow, driven primarily by e-commerce demand from Asia. Despite a seasonal slowdown, this growth is a promising sign for the future.
-
While air cargo capacity has increased, particularly on Transpacific routes, freight rates remain elevated due to strong demand and rising fuel costs. Ocean freight faces challenges like schedule reliability issues and ongoing supply chain disruptions.
DEMAND COMMENTARY – AIR
-
Global air cargo demand continues to climb in June. It reflects a +10% year-over-year (YoY) increase vs. last year, driven mainly by buoyant Asian e-commerce demand, albeit a traditionally quieter summer period.
-
From a capacity perspective, global air cargo capacity growth remains solid, primarily driven by Transpacific routes, which reflect a strong +7% YoY growth.
-
Global prices remain significantly higher than last year due to elevated demand and high rates from Asia and the Middle East. Air freight rates are also anticipated to stay higher than usual, particularly in Europe.
-
Peak season surcharges and significant spot rate increases are expected by the end of Q3.
-
The Jet Fuel spot price remained steady at USD 100 per barrel in June (the same level as the previous month), with higher prices forecasted going forward due to ongoing global oil inventory declines, partially driven by OPEC+ production cuts.
DEMAND COMMENTARY – OCEAN
-
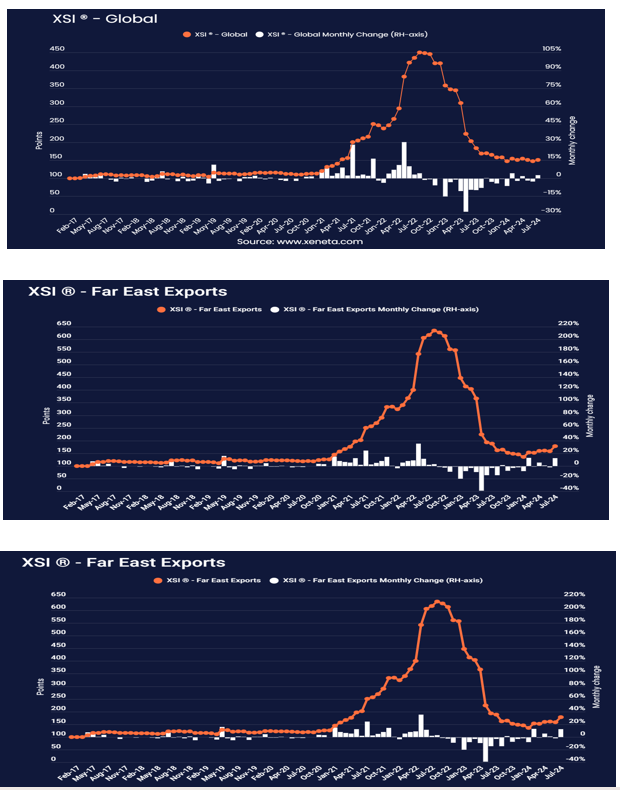
The ocean mode landscape shows that the Global XSI® reached 151.5 points in July. While this is still 4.0% lower than December last year, it represents a 2.5% month-over-month (M/M) increase from June.
-
The impact of vessel diversion on intra-regional services is significant, as smaller vessels are redirected to long-haul trades, disrupting the regional trade balance.
-
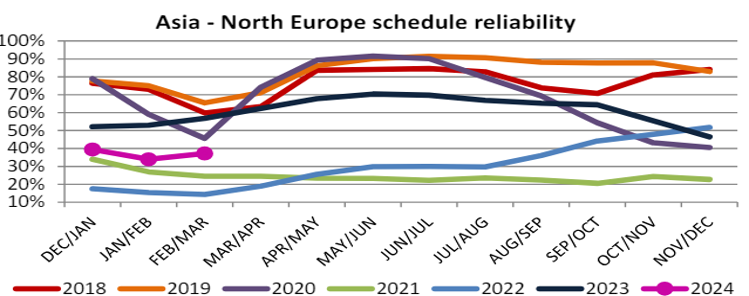
From a schedule reliability perspective, challenges remain as carriers struggle. Global schedule reliability remains at 50% to 55% of ships arriving on time or less, translating to only two in five ships arriving on time on significant trades.
-
In June 2024, global schedule reliability dropped by -1.2 percentage points M/M to 54.4%, while on a YoY level, schedule reliability in June 2024 was -9.8 percentage points lower.
-
The average delay for LATE vessel arrivals also deteriorated, increasing by 0.04 M/M to 5.19 days. This is now the third-highest figure for the month, only surpassed by the pandemic highs of 2021-2022. On a YoY level, the June 2024 figure was 0.82 days higher.
-
The guidance, therefore, underscores the necessity of including a one- to two-week short-haul and two- to three-week long-haul lead-time extension in shipment forecasts to de-risk any potential disruptions.
-
Similarly, a strong recommendation is to continue providing a four-week rolling forecast and minimally placing bookings in advance by at least four weeks.
-
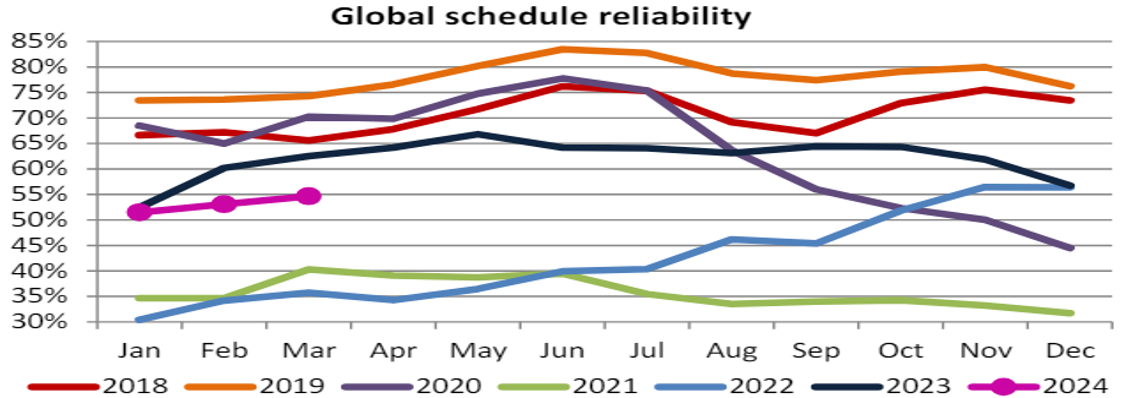
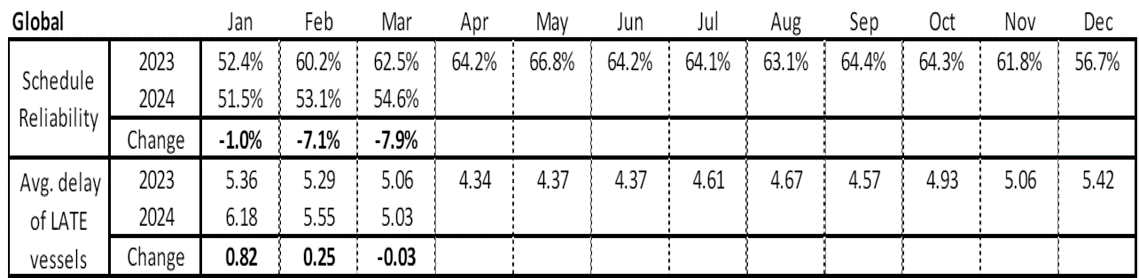
More notably, the underlying XSI® sub-index for Far East Exports, which includes the world’s biggest front haul trades to Europe and the US, increased 12.6% in July to 178.8 points. This coincides with short-term trends on significant trades from the Far East to the US and Europe beginning to soften in July from the massive increases seen over recent months.
-
On the capacity side, the ocean supply chains remain under pressure with additional potential disruptions.
-
Diversions are still in place in the Red Sea. Most container ships continue to sail around the Cape of Good Hope and have extended beyond the primary affected routes, causing congestion at alternative routes and transshipment hubs.
MARKET DYNAMICS - GROUND AND COURIER
-
Courier freight mode and channels remain unchanged. They are operating normally, though they remain at elevated prices/rates arising from general rate increases (GRIs) and fuel costs, plus the update of an impending additional Demand Surcharge to be implemented by carriers in September 2024.
-
China's domestic transportation market remains unchanged and operates normally with available capacities.
-
Intra-Asia cross-border ground transportation channels usually operate at the Chinese/Hong Kong and South Asian borders. All channels are flowing, and capacities are available.
DEMAND TRENDS & FORECASTS – AIR
-
Global air cargo volumes saw a slight decline in June compared to the previous month but are still higher than last year’s period, showing a +10% YoY increase.
-
The e-commerce boom, in particular volumes out of Asia, remains a significant driver of global air cargo demand growth. However, demand has been flat since early June, with a 2% volume drop from May due to the quieter summer period.
-
Additionally, ocean freight disruptions and gradual improvements in global manufacturing activities continue to increase air cargo demand.
-
The air cargo market is forecast to remain strong in established and emerging markets in the second half of 2024.
-
Interest in China-to-US air cargo charters surges as a reliable and cost-effective alternative to ocean freight with the peak season approaching.
DEMAND TRENDS & COMMENTARY – OCEAN
-
The Global XSI® reached 151.5 points in July. While this is still 4.0% lower than December last year, it represents a 2.5% month-on-month increase from June.
-
Despite the relatively small change in the Global XSI®, several sub-indexes post the highest growth in many months. Generally, the front-haul trades have seen long-term trends increase month-on-month in July, while the backhaul trades have continued to fall, matching the development of the spot market this month.
-
Most notably, the underlying XSI® sub-index for Far East Exports, which includes the world’s biggest front haul trades to Europe and the US, increased 12.6% in July to 178.8 points. The 12.6% increase in July is slightly lower than the 13.0% increase in February, but it still leaves this sub-index at its highest since July 2023.
-
The trades included in this sub-index, namely the front hauls to North Europe, the Mediterranean, the US East Coast, and the US West Coast, are the most important for global shipping. Therefore, a double-digit month-on-month increase is significant for the market.
-
This is the only XSI® sub-index to have increased this year, up 22.2% from the end of December 2023. YoY, the XSI® sub-index has fallen the least, down by only 5.2% from July 2023. This compares to a year-on-year decrease of 17.5% on the Global XSI® in July.
-
The sub-index for Far East imports fell to 94.1 points in July. This is 15.7% lower than in June and the lowest this sub-index has been since Q1 2020.
-
This is the second time this year that the Far East Import sub-index has fallen below 100 points, which means it is now below the rate levels in January 2017 - the base for the XSI® index. Far East Imports remains the only trade to have dropped below this milestone post-pandemic period.
-
In contrast to the pandemic years, the backhaul trades included in this index have not followed increases in the front-haul trades. This is perhaps because carriers did not face the same pressure to turn containers around as quickly as possible compared to the severe equipment shortages during the pandemic.
DEMAND COMMENTARY – COURIER AND GROUND
EXPRESS/COURIER:
-
Demand continues to remain unchanged.
-
All channels are operating normally and flowing with sufficient capacity for support.
GROUND FREIGHT
- Asia's domestic truck freight mode remains unchanged, including within domestic China and cross-border trade lanes to Hong Kong and Southeast Asia. Demand remains stable, and sufficient capacities support it.
ASIA SUPPLY COMMENTARY – AIR
-
Global air cargo capacity rose by +10% yearly compared to April'233, driven by expanding passenger belly capacity.
-
Summer schedules suggest widebody belly capacity will likely exceed summer 2023 levels by double digits. Air cargo BSAs from AP to the US and EU are fully booked for 2024 as Chinese e-commerce giants secure the capacity to meet rising demand.
-
Capacity growth varies significantly across trade lanes and is influenced by airspace closures, e-commerce expansion, and production shifts.
-
The Asia Pacific region is projected to increase widebody belly capacity in anticipation of the summer 2024 traffic season.
-
Conversely, there are capacity constraints in the AP-MEA route, with airlines canceling flights to avoid tension zones.
-
The ongoing conflict in the Middle East has caused airlines to re-route. These re-routings take longer than usual, significantly impacting cargo payload between Asia and Europe.
-
Throughout May, e-commerce demand is expected to decrease compared to April. The exception to this
-
The days leading up to Mother's Day were included when charter demand for fresh flowers boosted traffic. With these factors in play, expect demand in May to remain similar to April.
-
While capacity has not increased as fast as forecast, expected rates will remain elevated.
SUPPLY COMMENTARY – OCEAN
-
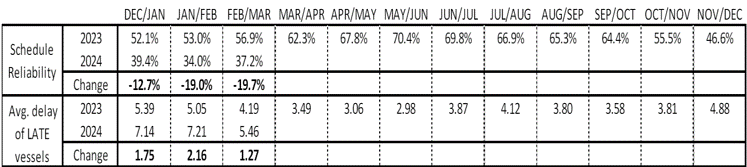
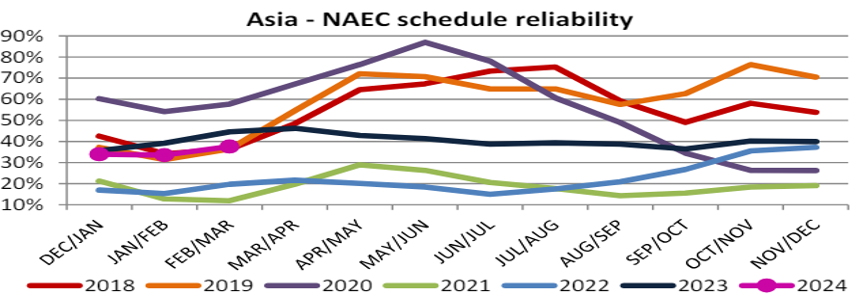
Schedule reliability on the Asia-North Europe trade lane increased by 3.2 percentage points M/M in February/March 2024 to 37.2%. On a Y/Y level, schedule reliability in February/March 2024 was lower by -19.7 percentage points compared to the 56.9% recorded at the same time last year.
-
The average delay for LATE vessel arrivals also improved, decreasing by -1.75 M/M to 5.46 days in February/March 2024. On a Y/Y level, the delay was higher by 1.27 days. The average delay for ALL vessel arrivals decreased M/M by -1.18 to 3.24 days.
-
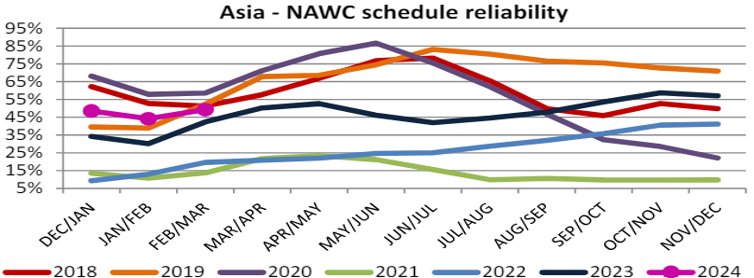
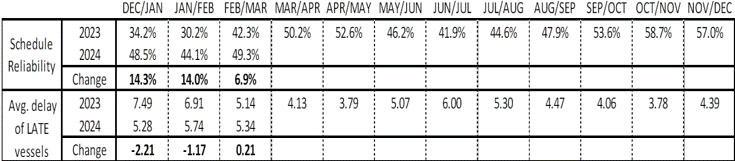
Schedule reliability on the Asia-North America West Coast trade lane decreased by 5.1 percentage points M/M in February/March 2024 to 49.3%. On a Y/Y level, schedule reliability in February/March 2024 was higher by 6.9 percentage points compared to the 42.3% recorded at the same time last year.
-
The average delay for LATE vessel arrivals improved, decreasing by -0.40 days M/M to 5.34 days in February/March 2024. On a Y/Y level, the delay was higher by 0.21 days. The average delay for ALL vessel arrivals decreased M/M by -0.70 to 2.26 days.
-
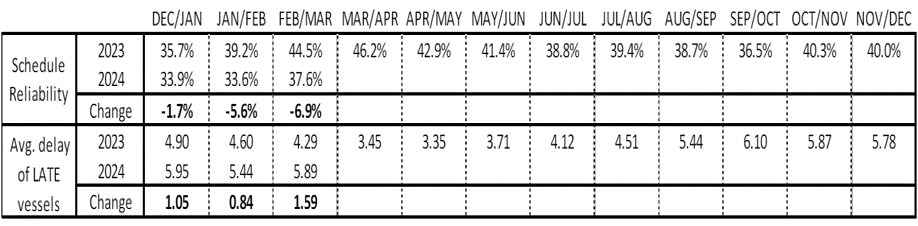
Schedule reliability on the Asia-North America East Coast increased by 4.1 percentage points M/M and reached 37.6% in February/March 2024. On a Y/Y level, schedule reliability was -6.9 percentage points lower than the 44.5% recorded at the same time last year.
-
On the other hand, the average delay for LATE vessel arrivals deteriorated, increasing by 0.44 M/M to 5.89 days. On a Y/Y level, the delay was 1.59 days higher than in 2023. The average delay for ALL vessel arrivals increased M/M in February/March 2024 by -0.05 days to 3.16 days.
-
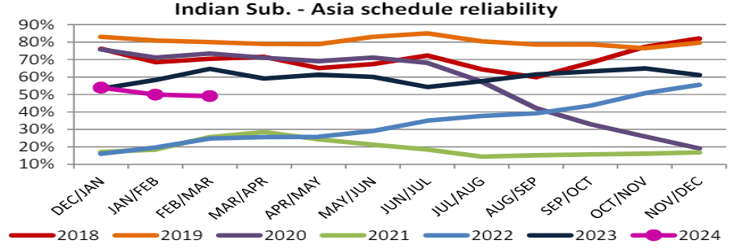
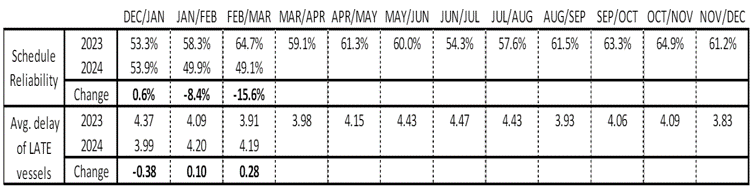
Schedule reliability on the Asia-Indian Subcontinent trade lane increased by 1.8 percentage points M/M in February/March 2024, reaching 58.2%. On a Y/Y level, schedule reliability was -4.9 percentage points lower than at the same point in 2023.
-
The average delay for LATE vessel arrivals improved M/M, decreasing by -0.24 M/M to 4.24 days. On a Y/Y level, the average delay was lower by -0.12 days compared to the same point in 2023. The average delay for ALL vessel arrivals decreased M/M by - 0.14 to 1.45 days.
-
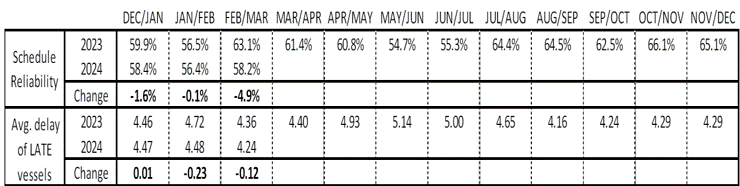
Schedule reliability on the Indian Subcontinent-Asia trade lane decreased M/M by -0.8 percentage points in February/March 2024, reaching 49.1%. On a Y/Y level, February/March 2024 schedule reliability was -15.6 percentage points lower than the 64.7% recorded at the same point in 2023.
-
The average delay for LATE vessel arrivals improved, decreasing by -0.01 days M/M and reaching 4.19 days. On a Y/Y level, February/March 2024 average delay was 0.28 days higher than at the same point in 2023. The average delay for ALL vessel arrivals increased M/M by 0.08 days to 1.88 days
.2024-06-26-15-07-39.png)
.2024-06-26-15-07-39.png)
SUPPLY COMMENTARY – COURIER AND GROUND
-
Courier: Capacities remain available and able to support all trade lanes and all channels operating normally
-
Ground: Capacities remain available, and with all channels flowing
-
Customs clearance between Shenzhen / Hong Kong and vice versa and at the border crossing between China and Vietnam flows and operates normally.
-
ASIA PRICING TRENDS & INSIGHTS - AIR
-
Global prices remain significantly higher than last year due to elevated demand and high rates from Asia and the Middle East.
-
Global average air cargo spot rates have since risen by +20% year-on-year. This was again driven by strong global cargo demand growth from buoyant e-commerce demand from Asia and the comparatively low demand base in the corresponding month in 2023.
-
For the air cargo market, it’s now all eyes on late Q3 for the first signs of a peak season, which would be the cherry on top of the cake for airlines after such unexpected volumes and demand growth in the first half of the year.
-
Shippers seek long-term contracts for stability and avoid higher rates during the Q4 peak season. Air freight rates are anticipated to stay higher than usual, particularly in Europe and America.
-
Peak season surcharges and major spot rate increases are expected by the end of Q3.
-
The spot price of jet fuel remained steady at USD 100/barrel in June, the same level as the previous month, while increasing to USD 104/barrel in July.
-
Brent crude oil spot price averaged USD 82 per barrel in June, unchanged from May, with its spot price averaging USD 84 per barrel in 1H24 and rising to USD 87 per barrel in July.
-
Higher prices are further expected in H2 due to ongoing global oil inventory declines, partially driven by OPEC+ production cuts.
-
The market forecast is for inventories to gradually rebuild in 2025 as OPEC+ cuts expire and non-OPEC+ supply starts offsetting growth in global oil demand.
PRICING TRENDS & INSIGHTS – OCEAN
-
Q3 has brought no respite for shippers, as many are still experiencing worsening market conditions. As we enter the second half of the year, these disruptions will likely continue unless a significant drop in demand occurs or if there is an easing of conflict in the Middle East, trade tensions, etc.; with the outlook until then, companies will likely continue pulling forward demand. This is especially true as they also consider the impending Chinese Golden Week beginning 1 October that will disrupt inbound flows nearer to the year-end holidays.
-
Spot rates have significantly increased since early May, primarily due to the rise in Transpacific and Asia-Europe trade lanes, which experienced an earlier-than-usual peak season and with the ocean container shipping market as observed reaching a tipping point in July, with long-term rates on major front-haul trades showing signs of increases just as spiraling short term rates begin to soften.
-
Increasing long-term rates and decreasing short-term rates mean the spread between the markets is narrowing. This presents a delicate balance ahead of long-term contract negotiations between shippers and carriers later this year, as carriers will be doing everything possible to keep short-term rates elevated for as long as possible.
-
Ocean freight container shipping spot rates have increased dramatically in recent months, but the long-term market landscape has been insulated from this volatility, perhaps until now.
-
However, rates on the major front hauls from the Far East to Europe and the US are now showing signs of upward pressure, but the backhaul trades remain subdued.
-
This is a key difference between the market spikes in 2024 and the pandemic period when backhaul rates also increased. This is perhaps an indication that equipment shortages are not as severe an issue in 2024 compared to the pandemic, meaning carriers are in less of a hurry to send containers back to the Far East for the next front-haul sailing.
-
The result is that long-term rates on backhaul trades from the US and Europe to the Far East are falling to levels not seen since 2020/21.
-
Therefore, a key question is how high long-term rates will rise before declines in the short-term market stunt growth. Right now, there is more room for spot rates to fall than for long-term rates to rise.
-
However, we must be ready to adapt, as many potential disruptions in the coming months could change the picture again.
-
-
The SCFI continues to reflect at high levels on rates on Trans-Pacific trade lanes while Far East Westbound remains relatively flat.
-
India's outbound lanes are also seeing a strong increase in demand, leading to increased rates and equipment shortages.
-
The outlook is that freight rates are anticipated to stay high until the end of the peak season or at least until post the China Golden Week.
-
Bunker price has rebounded, jumping from the lowest level in the past ten months in early Jun to USD 644/mt in early July, the highest level the last month, adding to overall elevated rates.
PRICING TRENDS & INSIGHTS – GROUND
COURIER
-
Pricing levels remain unchanged and elevated.
-
An additional ‘Demand (Peak) Surcharge ‘, which carriers will implement in late Q3, will further exacerbate the situation.
GROUND
-
Asia domestic truck freight rates and cross-border intra-Asia truck-mode freight remain unchanged and stable as the landscape remains competitive and has sufficient capacity to support it.
LOGISTICS - ASIA: KEY TAKEAWAYS
-
Strong YoY growth in air cargo demand is expected to extend into August and September, partly due to the low base set last year.
-
For the air cargo market, it’s now all eyes on late August for the first signs of a peak season after such unexpected volumes and demand growth in the first seven months of the year
-
Looking at regional developments in July, the Middle East and Central Asia to Europe continued to lead YoY growth, while outbound Southeast Asia to North America and Europe lanes took second and third place in terms of growth, with surging cargo demand bringing about more than doubled cargo spot rates from a year ago.
-
These lanes were followed by outbound Northeast Asia markets, supported by solid e-commerce demand and recovery in general cargo volumes.
-
Conversely, backhaul trades on the above lanes experienced year-on-year declines. This was due to adequate capacity on the return leg and increased belly capacity on passenger flights to meet the summer holiday season demand.
-
From a Jet Fuel perspective, prices remain elevated, and higher prices are expected due to ongoing global oil inventory declines, partially driven by OPEC+ production cuts.
-
As disruptive events worldwide continue to impact transportation markets, air freight will be leaned upon to fill gaps in service, creating periods of tight supply and increasing rates. As we approach the peak time of the year, carriers are starting to think these tailwinds will hold out.
KEY TAKEAWAYS – OCEAN
-
As the Red Sea disruptions continue, carriers adjust schedules, including increased blank sailings and port skips. These actions compound the supply challenge and lead to deterioration in on-time performance.
-
This has resulted in shippers adding to the stress by increasing demand and pulling orders forward to ensure stocks are delivered on time.
-
Additionally, tariff policy changes combined with increased output in new manufacturing centers, such as India and Vietnam, have added to the complexity driving market dynamics.
-
High volumes can also be attributed to an early start to the peak season, driven by nervous shippers not wanting a repeat of the pandemic shortages. This has driven global container volumes to a new record high since May 2024, when 15.94m TEU were moved, although the outlook is that this pace of demand seems unlikely to last through to the end of the year.
-
The observation, though, is that this early start to peak season suggests either that this peak season will end early this year or peak season volumes will be distributed across more months than usual.
-
Additionally, this is further exacerbated by the impending Chinese Golden Week beginning October 1, which will disrupt inbound flows nearer to the year-end holidays.
-
Finally, port congestion continues to be a problem and is spreading to more ports as carriers attempt to avoid chokepoints, adding to the overall constraint landscape.
-
As we enter the final quarter of the year, these constraints will likely continue, and unless demand significantly drops or these disruptions ease, the outlook is envisaged to remain challenging.
GLOBAL LOGISTICS
EUROPE
EUROPEAN LOGISTICS - MARKET DYNAMICS
-
The global economy grew 3.2% in 2023 and is forecast to grow at the same pace through the end of 2024 and into 2025.
-
Economic conditions for consumers and businesses in the EU and the US are expected to improve by the end of 2024. Inflation has fallen to 3.3% in the US and 2.6% in the EU, which has prompted the European Central Bank to lower interest rates, with further reductions expected later in the year.
-
The increased import tariffs that the EU and US have decided to apply to specific Chinese products are not immediately a primary concern. However, a further escalation of the disputes could have a significant impact.
-
So far, China has not reacted by increasing its import tariffs but is studying possible increased tariffs on pork imports from the EU, which could reduce the demand for refrigerated containers to transport these goods, leading to a decline in reefer volumes.
-
-
In addition, if Donald Trump wins the US Presidential Election in November, he has announced plans to impose 10% tariffs on all US imports and specifically apply a 60% tariff on imports from China. This could negatively impact US import volumes by raising costs for the average consumer and encouraging a shift in production from China to the US and Mexico.
-
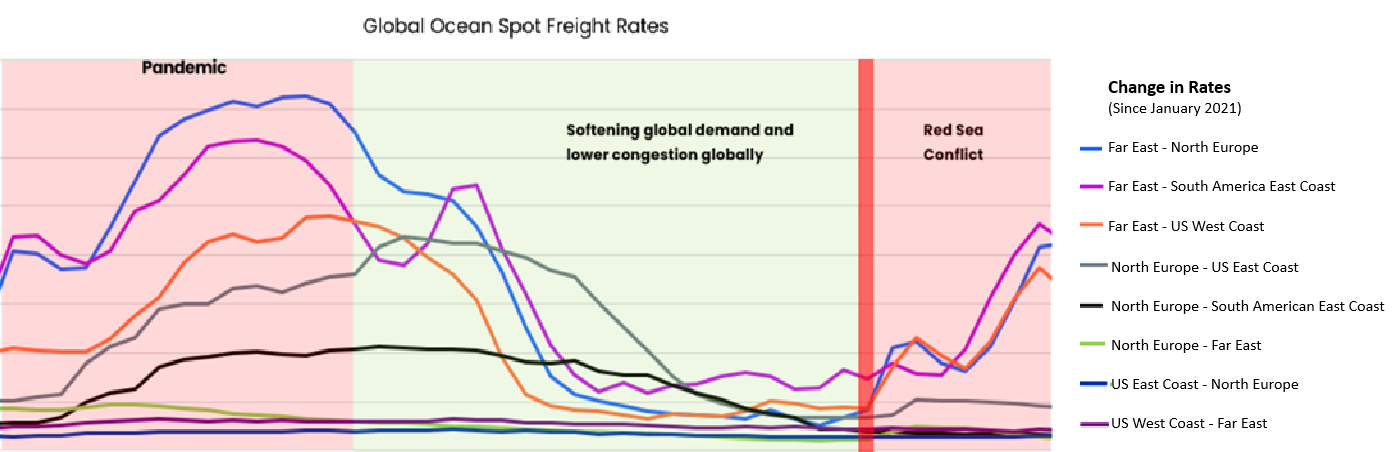
The continuing tension in the Middle East and the risk of attack from Houthi rebels and their allies has led to a more than 60% reduction in traffic through the Suez Canal, directly impacting logistics in Europe. Companies involved in indirect procurement now face longer transit times as vessels are rerouted around the Cape of Good Hope, increasing shipping costs and fuel consumption. This disruption is particularly challenging for European supply chains, which rely on steady, predictable logistics services.
DEMAND TRENDS & FORECASTS - AIR
-
Solid e-commerce growth and disruptions in the Red Sea trade lanes drive a steady increase in global air cargo rates, overturning traditional seasonal benchmarks.
-
Despite historically slow summer seasons for air cargo, demand across significant trade lanes – especially from Asia – has remained robust, with no signs of slowdown.
-
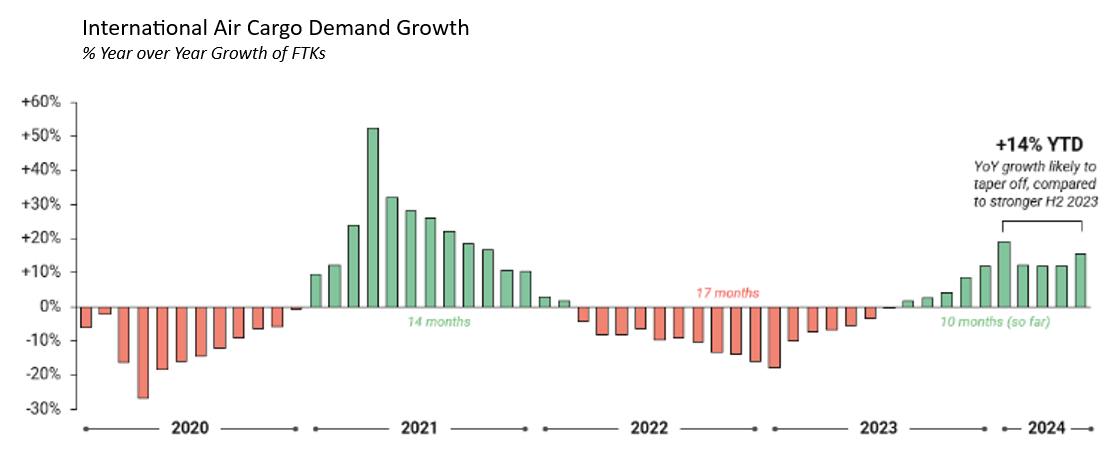
In 2023, the air cargo sector experienced a significant slump due to weakened demand, with traffic well below the pandemic-boosted highs of 2021. By mid-2023, air cargo traffic had posted 17 consecutive months of year-over-year declines. This trend reversed in the latter part of 2023.
-
As of August 2024, air cargo demand has recorded 13 consecutive months of year-over-year growth, with double-digit increases over the past six months. While growth is expected to persist into the fourth quarter of 2024, it will likely moderate to single digits due to stronger comparisons against late 2023's elevated performance.
-
Another factor driving demand is order pull-forward strategies by European and US companies. These companies secured capacity earlier in the year to avoid the typical peak-season constraints and freight rate hikes between August and January.
-
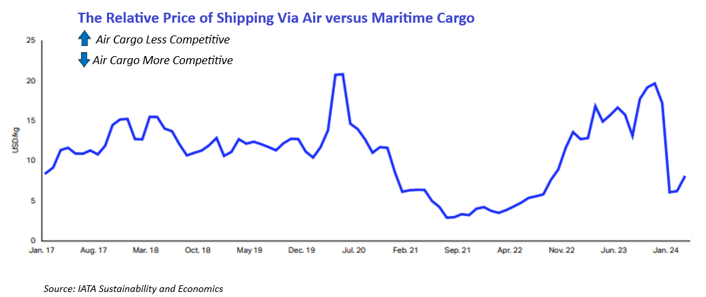
Additionally, the recent spike in ocean freight prices has lowered the relative cost of air cargo, boosting its competitiveness. This shift has been compounded by increased ocean transit times due to diverting around the Cape of Good Hope, pushing more shippers to switch from ocean to air freight.
.2024-09-23-18-48-04.png)
DEMAND TRENDS & FORECASTS - OCEAN
-
Demand exceeded expectations in the first half of 2024, partly due to companies advancing shipments as a precautionary measure. Container shipping volumes from Asia to Europe grew approximately 4.8% year-over-year between March and May 2024, reflecting strong trade activity.
-
Demand remains robust as of the end of Q3 2024, though June's global PMI indexes indicate declining business confidence. Expectations dropped to their lowest point in seven months, influenced by political uncertainties surrounding upcoming elections. Despite this, global growth momentum appears stronger compared to late 2023.
-
However, the rise in demand has not been without challenges. There have been instances of blank sailings due to insufficient capacity across services.
With the idle container vessel fleet at a critically low level (~0.9% in April 2024), the capacity to manage all scheduled sailings remains limited, straining the supply chain despite the demand surge,
DEMAND TRENDS & FORECASTS - GROUND
-
According to the latest International Road Transport Union (IRU) forecast, EU road freight volume growth is expected to improve to 0.4% YoY in 2024 (up from -1.1% in 2023). This will be possible due to real wage growth (as inflation slows) and a strong labor market supporting a rebound in consumption.
SUPPLY ANALYSIS - AIR
-
On the supply side, forwarders and carriers struggle to secure capacity. This is partly due to the reduced delivery of large widebody freighters.
-
For instance, engine supply issues and quality assurance efforts have limited Boeing’s deliveries of B777-200LRF freighters to just seven this year. Additionally, ongoing production issues at Boeing and high demand for passenger aircraft have delayed the certification of the upcoming Boeing 777-P2F conversions.
-
Between January 2023 and June 2024, Airbus and Boeing delivered 278 widebody aircraft in passenger and freighter configurations. Twelve airlines or airline groups accounted for 140 deliveries, slightly more than half the total—Turkish Air. In Asia Pacific, only two top airlines are increasing their widebody capacity.
-
Around 20% of global air cargo volumes are linked to e-commerce. There are backlogs and capacity constraints at the main airports in Asia, such as Shanghai’s Pudong Airport, Hong Kong, Incheon in South Korea, and Narita in Japan.
-
Airlines are restricted from adding capacity mainly due to current Qatar Airways and Air France-KLM, and two of the three major express carriers, FedEx and UPS, were leading the industry in adding widebody aircraft geopolitical issues such as the conflict in Ukraine and Israel, which have constrained airspace and affected global routes which have extended journey times.
-
Predicting any dramatic improvement if e-commerce grows and new capacity enters the market slowly is hard.
SUPPLY ANALYSIS - OCEAN
-
The first half of 2024 saw a substantial addition of 1.7 million TEU of newly built containership capacity. However, the year’s second half is expected to slow the introduction of new vessels.
-
The ultra-large vessel segment (+23,500 TEU), the OOCL Denmark, was added to the fleet two months ago. With only one ship of this size expected to be delivered per month for the remainder of 2024, the upscaling of Far East to North Europe services will lose momentum.
-
Despite the recent influx of new capacity, Asia-to-Europe services still face a 10% shortage, according to Alphaliner’s latest research. Alphaliner reported, “With an average vessel size of 14,150 TEU on this trade, approximately 509,400 additional slots are required – representing 9.6% of total capacity – to maintain weekly sailings across all alliance loops.”
-
Vessel delays are easing at key ports in North and Southeast Asia, improving equipment availability in China. However, congestion is shifting to India, where potential strikes could further disrupt operations. Ports such as Singapore, Ningbo, Qingdao, and Klang (Malaysia) have seen reduced delays, but the situation in Europe is more challenging.
-
At the Container Terminal Burchardkai (CTB) in Hamburg, Germany, ongoing labor disputes are causing significant delays and container backlogs. Yard utilization is 83%, driven by longer port stays and extended import pick-up times.
-
Limited trucking availability continues to restrict the smooth movement of goods from ports across several European countries—Poland, Denmark, Sweden, and Finland — further compounding logistical bottlenecks.
-
Meanwhile, Hapag-Lloyd and Maersk are planning a collaboration through the Gemini Alliance, combining their fleets of 290 vessels with a total capacity of 3.4 million TEU.
-
This partnership could influence market rates and competition and is currently under review by the US Federal Maritime Commission (FMC).
-
The Gemini Alliance will cover seven global trade routes and offer 26 mainline services across 12 key hubs, potentially providing shippers with more efficient and flexible shipping options.
-
SUPPLY ANALYSIS - GROUND
-
After a challenging 2023, the European road freight industry has shown modest improvement, with load demand and truck supply becoming more balanced. Road freight demand grew in the first half of 2024, with both international and domestic routes experiencing a boost due to improved economic conditions.
-
Additionally, regional disruptions, such as the now-resolved rail strike in Germany and ongoing attacks on cargo ships in the Red Sea, have led shippers to shift to road freight as a more reliable option. Although road freight solutions from China to Europe are available, they come at a high cost—approximately USD 20K+ per full truckload (FTL) – with transit times of 32–35 days.
-
According to the latest IRU forecast, EU road freight volume will grow by 0.4% YoY in 2024, up from a contraction of -1.1% in 2023. This growth is expected due to a combination of real wage growth as inflation cools and a strong labor market driving a rebound in consumer demand
EUROPEAN LOGISTICS - PRICING TRENDS & INSIGHTS - AIR
-
Air cargo rates are expected to remain high through the second half of 2024, driven by disruptions in the Red Sea and additional US tariffs on Chinese goods. This will prompt shippers to place orders earlier in anticipation of peak season.
-
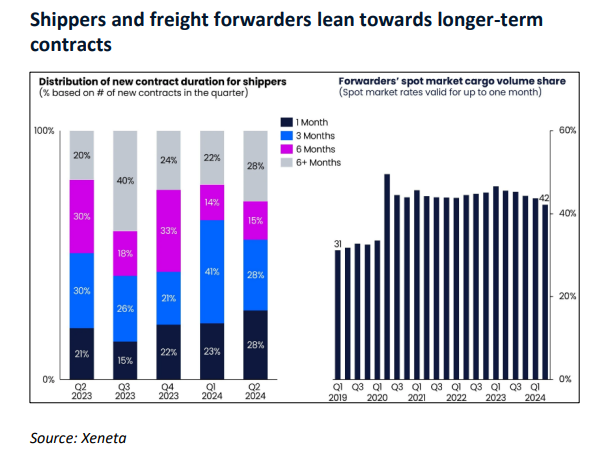
In Q2 2024, contracts lasting more than six months gained market share, accounting for 28% of all contracts. This increase indicates that shippers are looking to secure rates ahead of the busy year-end season. At the same time, the rise in one-month contracts reflects growing pressure to lock in longer-term agreements as freight forwarding rates climb. Conversely, the decline in three-month contracts suggests anxiety about renegotiating rates just before the peak season begins.
-
The continuing difficult situation in the Red Sea has increased expectations of elevated air cargo rates throughout the year. Houthi militant attacks on commercial vessels in the Red Sea and the Gulf of Aden have disrupted ocean shipping routes, forcing ships to take longer transits around Africa. Combined with early peak season congestion, these factors push urgent shipments into the air freight market. With no signs of a reopening of Red Sea routes shortly and a worsening regional security environment, further price increases are expected as we approach Chinese New Year (CNY).
PRICING TRENDS & INSIGHTS - AIR
-
Air cargo rates will remain elevated through the second half of 2024 as the ongoing disruption in the Red Sea and additional US tariffs on Chinese goods drive shippers to advance orders ahead of the peak season.
-
In the second quarter of 2024, contracts with durations exceeding six months led the market, accounting for an increasing share of 28%.
-
Compared to the previous quarter, the increase in over-six-month contracts suggests that shippers are eager to lock their rates for the year-end peak season. Meanwhile, the rise in one-month contracts shows increased pressure to maintain longer-term contracts amid rising freight forwarding procuring rates. In contrast, the fewer three-month contracts reflect anxiety about renegotiating just before the peak season.
-
The persistently challenging Red Sea situation: Further adding to the expectations of higher rates throughout the year was the ongoing disruption to ocean shipping caused by Houthi militant attacks on commercial shipping in the Red Sea and Gulf of Aden. The longer ocean transits around Africa and congestion from an early peak season continue to force shippers of urgent cargo into the air. There are no indications that routes through the Red Sea will reopen soon. The regional security situation has deteriorated over the past few weeks; as a result, many expect higher prices leading up to the Chinese New Year.
-
In July 2024, the spot rate from the EU to the US fell by 4% to USD 1.69 per kg, primarily due to increased belly capacity from summer passenger flights. Also, the spot rate from the US to the EU fell by 5.5% week-over-week.
PRICING TRENDS & INSIGHTS - OCEAN
-
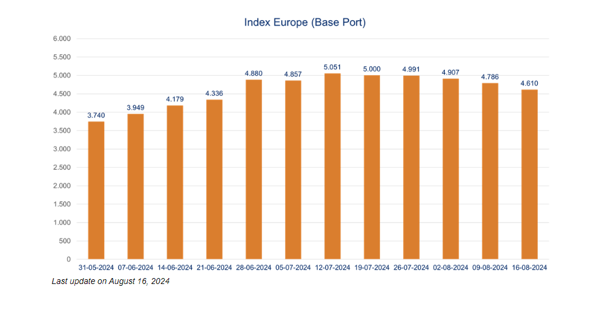
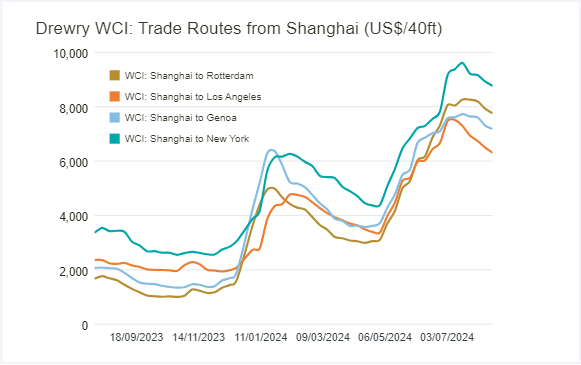
As of September 2024, container shipping freight rates continue to decline, following a general trend seen over the summer. Spot rates across major routes, particularly from Shanghai to New York and Rotterdam, have dropped significantly, with reductions as high as 21% on certain routes. This trend reflects overall weak demand as global trade conditions remain soft. However, rates have slightly increased from Los Angeles to Shanghai, driven by a shift in shipping activity ahead of an anticipated strike in the US.
PRICING TRENDS & INSIGHTS - GROUND
-
Both spot and contract rates have fluctuated. Spot rates have experienced a slight seasonal uptick while contract rates have stabilized. Rising fuel prices and increased tolls have significantly impacted operating costs for road freight providers.
EUROPEAN LOGISTICS - KEY TAKEAWAYS
The Global Freight Market remains extremely volatile, mainly due to global conflict. This has led airlines and ocean lines to reroute to avoid war zones, increasing costs and transit times.
AIR FREIGHT
-
Consider fixing prices now to cover the period up to the end of the Chinese New Year. This may cause short-term increases in rates, but it should help keep your freight moving during periods when volumes spike and protect you from peak season surcharges. Adopting this strategy allows you to seek a smoother operation and potentially better financial outcomes.
OCEAN FREIGHT
-
Monitor actual transit times closely and adjust procurement systems to reflect the real world. Where possible, provide forecast volumes ahead of shipment booking.
-
These factors signal prolonged disruption to supply chains — less so for container carriers reaping yet another unexpected windfall — and one that will continue to impact container shipping markets for months by absorbing vessel and equipment capacity and lengthening transit times.
ROAD FREIGHT
-
EU road freight volume is expected to grow by 0.4% YoY in 2024 due to real wage growth and a rebound in consumption, up from a decline of -1.1% in 2023.
-
However, challenges remain, including rising fuel prices and potential disruptions due to geopolitical events.
GLOBAL LOGISTICS
AMERICAS
MARKET DYNAMICS
-
The logistics sector in the United States is dynamic and characterized by a delicate balance between cost management, technological innovation, and sustainability.
-
Freight costs are declining but still higher than pre-pandemic levels. Companies are increasingly integrating technology, facing labor market constraints, and responding to sustainability pressures. Additionally, geopolitical factors and e-commerce growth continue to shape the sector, driving the need for more efficient, diversified, and environmentally conscious supply chain strategies..
DEMAND TRENDS & FORECASTS - AIR
-
The air cargo market has grown steadily in the Americas, with CTKs increasing by approximately 12.3% year-over-year (YoY). The region has benefited from strong e-commerce activity and recovery in manufacturing sectors. Seasonally adjusted data indicates a 0.7% rise in CTKs from May to June, reflecting sustained demand despite global economic challenges.
-
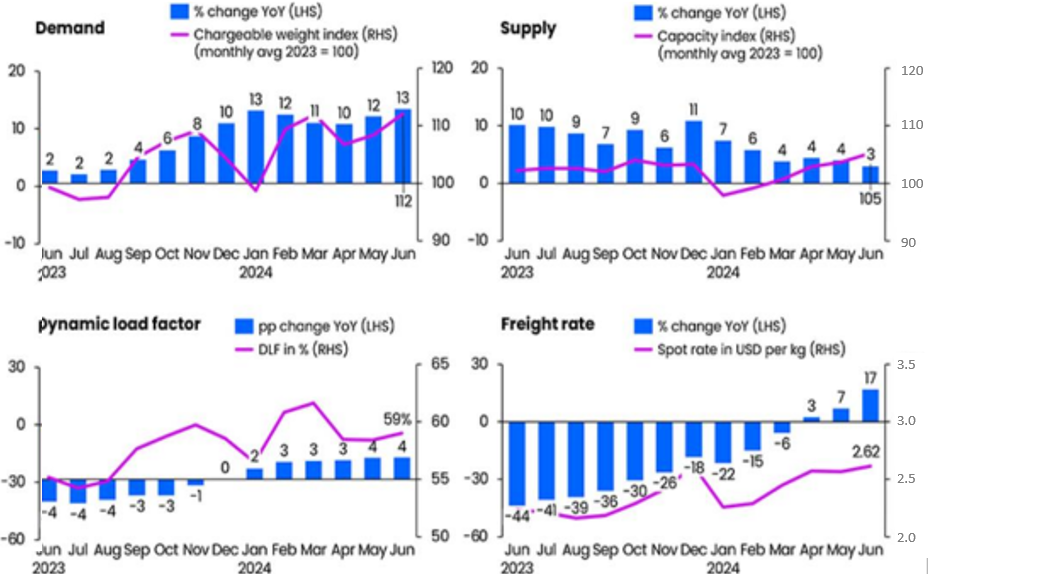
Global Cargo Ton-Kilometer (CTK) demand expanded by 14.1% year over year in June. After seasonal adjustment, CTK grew by 0.9% in June compared to May.
-
International CTKs increased by 15.6% YoY globally in June.
GLOBAL TRENDS & FORECASTS – OCEAN
-
Demand for the Asia-to-Americas market has stabilized following a peak in late July. Current shipments from China, Malaysia, Vietnam, and Singapore to the U.S. require a four-week booking lead time. In June, demand for Asia-to-North America routes was up 5.8% compared to May.
-
The market is expected to remain flat, leading to the early October cut-off for the end of 2024.
-
Carriers have maintained capacity discipline despite the stabilization in demand, which has helped prevent significant rate declines. However, with the approaching peak shipping season and potential disruptions in supply chains, there may be sporadic rate fluctuations and capacity constraints, particularly for high-demand routes into major U.S. ports.
DEMAND TRENDS & FORECASTS - GROUND
Express/Courier
-
FedEx experienced a modest 1.1% decline in demand during the March-May period compared to the previous quarter, reflecting softer market conditions.
-
UPS reported a 0.17% increase in quarter-over-quarter (QoQ) volumes despite an 8.55% decline since the end of 2023, indicating a partial recovery.
-
DHL saw a 3.2% drop in QoQ volumes in Q2, with a 2.7% YoY decline, suggesting persistent challenges in maintaining growth momentum.
Ground Freight
-
Full Truckload (FTL) Market Outlook: There is optimism that typical seasonal trends and truckload (TL) freight demand will normalize in 2025, potentially reversing the current downturn.
-
Current Demand Indicators: The Cass Freight Index reported a 1.8% month-over-month (M/M) decline in North American freight demand for June, reflecting ongoing softness in the market.
-
The decline in freight demand, as indicated by the Cass Freight Index, reflects a broader slowdown in the logistics sector.
-
This downturn is attributed to reduced economic activity, softer consumer demand, and ongoing adjustments in supply chain dynamics, which have impacted both FTL and Less-than-Truckload. (LTL) markets.
SUPPLY ANALYSIS – AIR
-
Global air cargo capacity was up 8.8% in June 2024 vs. June 2023.
-
The current capacity levels are the highest they have been, and with significant market demand, airlines will most likely continue to build up their capacity.
-
The IATA Actual CTK chart shows a continued increase in capacity.
-
Air cargo capacity grew primarily on international routes, where the industry registered an expansion of 10.8% YoY in June.
-
The North American export market continued to grow by 7.2% YoY.
-
The IATA International load factor statistic has increased to 50.8%. North America dropped to 47%, a 1.5% decrease in QoQ. So, rates could improve after we get past the September-November peak season.
-
International cargo capacity on dedicated freighters rose 4.1% in June vs. May.
SUPPLY ANALYSIS – OCEAN
-
Capacity is improving on most trade lanes. However, some South Asian-origin countries, such as Singapore and Indonesia, have tight capacity.
-
Carriers are working to add more capacity to take advantage of the market.
-
The Panama Canal has updated its available slots to 36 daily transits in August, bringing them back to their normal level. This will allow more ships to transit through the canal and into the US Gulf or East Coast.
-
Ocean lines added capacity on the Far East to US West Coast lanes in July, improving capacity for July-August and beyond.
-
Offered capacity has increased to 320,000 TEU per week – 10% higher than the average in the first half of 2024.
-
The 20-foot equivalent unit (TEU) is a general unit of cargo capacity used for container ships and ports. It is based on the volume of a 20-foot-long (6.1 m) intermodal container.
SUPPLY ANALYSIS – GROUND
EXPRESS/COURIER
-
The shift of the USPS air cargo contract from FedEx to UPS this September will significantly affect the shipping industry.
-
Capacity Strain: UPS will experience a surge in volume, potentially straining its existing capacity and leading to increased shipping times or costs.
-
Open Capacity: FedEx will have excess capacity, which could create opportunities for shippers seeking alternative carriers or negotiated rates.
-
Shifts in Market Dynamics: The USPS’s primary carrier change could alter market dynamics, potentially impacting pricing and service levels across the industry.
-
FedEx is altering its express network handling to allow express freight to move through alternative handling terminals to separate freight from express. This operational adjustment should streamline their handling capabilities and allow for more throughput.
GROUND FREIGHT
-
The American Trucking Association’s advanced seasonally adjusted For-Hire Truck Tonnage Index decreased 1.6% in June after increasing 3% in May.
-
Trucking companies are leaving their equipment in place and actively looking to fill open capacity and backhaul opportunities to drive new revenue.
-
New partnership opportunities could emerge for businesses that can provide consistent volume or strategically align with these carriers' needs.
-
This alignment could lead to mutually beneficial arrangements, such as long-term contracts that secure capacity at favorable rates.
PRICING TRENDS & INSIGHTS – AIR
-
In the second week of August, freight forwarder buy cargo spot rates dropped by 3% M/M after peaking in mid-July
-
The airlines are pushing to incorporate a peak season surcharge for September-November into their rate updates, increasing the market.
-
Most markets' sell rates increased in June and continued throughout August.
-
The Xeneta ATA index for long-term rates below shows a USD .18/kg increase in Q2 for China Main to the US, representing the increases for Asia into North America. In July and early August, the spot costs continue increasing to USD 5/kg.
PRICING TRENDS & INSIGHTS – OCEAN
-
Since May, the Xeneta Far East to the US West Coast index has increased by 34.34% (USD 1,677) to USD 6,600.
-
Since May, the Far East to US East Coast index has increased by 61.67% (USD 3,648) to USD 9,563.
-
Port-to-Port rates for the lanes can also be much higher than the index values.
-
Overall, rates remain high; the ocean lines review them monthly.
PRICING TRENDS & INSIGHTS – GROUND
EXPRESS/COURIER
-
UPS: Starting in late September 2024, UPS will take over a significant USPS air cargo contract from FedEx. The company is expected to leverage this new volume to justify higher express rates, particularly toward the end of the year and into 2025. The increased demand from this contract and a strong air freight market suggest that UPS will focus on surcharges and dimensional weight pricing, which could drive up costs for shippers, especially during peak seasons.
-
DHL: DHL is actively pushing for a demand surcharge from August 2024 through February 2025 to cover the rising costs of international shipments. This aligns with their broader strategy of adjusting rates to meet market conditions, including peak season surcharges and increased fuel costs.
-
FedEx: While FedEx has announced its demand surcharges, the loss of the USPS contract leaves it with excess capacity and a strategic decision to either hold rates steady or potentially lower them to attract new business. FedEx's approach may involve more aggressive pricing to fill its expanded operational network and offset the loss of this significant contract.
GROUND FREIGHT
-
Ground freight rates have shown variability recently.
-
After a notable increase in May 2024, the Cass Inferred Freight Rates™ saw a slight decline of 1.4% month-over-month in June. This dip follows a broader trend of fluctuating demand and pricing in the freight market.
-
The direction of rates will likely depend on economic conditions, inventory levels, and ongoing supply chain disruptions, including port congestion and equipment shortages, particularly in international shipping lanes.
-
The peak season of August through November should provide opportunities for the FTL providers to find additional loads, drive revenue, and increase the spot market rates.
KEY TAKEAWAYS - US LOGISTICS
AIR FREIGHT
-
The global air market remains tight, and airlines and forwarders are pushing to charge more for the limited space. With peak surcharges being requested, September to November this year could be more expensive and make it difficult to find space.
-
The September-to-November period will continue to be a fight for available space, and companies will have to work to retain forwarders' committed capacity.
OCEAN FREIGHT
The Ocean market is starting to flatten at higher rates.
-
The short-term Asia-US market has begun to allow one-month and three-month pricing, an improvement over the rolling two-week rate refreshes we saw in June and July.
-
As the additional capacity continues to come online and demand hopefully subsides in November, the end of 2024 could create a scenario for shippers to lock in longer-than-three-month pricing.
EXPRESS/COURIER
-
UPS and DHL continue pushing off new business and seeking to increase pricing for existing customers.
-
It appears clear that UPS and DHL will drive up costs this fall, and FedEx’s future remains open.
GROUND FREIGHT
The North American ground market has been soft lately and has depressed rates.
-
Long-term rates have been achievable lately, but the spot market could increase with the beginning of the peak season of August into November.
-
Overall, shippers should target to lock in rates and capacity to cover you until late 2025 before the holiday season demand alters the market too much.
Back to Top