

By clicking the “I Accept” button, or by accessing, participating, or submitting any information, or using the Jabil Global Intelligence Portal or any of its associated software, you warrant that you are duly authorized to accept the Global Intelligence Portal Terms and Conditions on behalf of your Company, intending to be legally bound hereby, and your company shall be bound by the terms and provisions of the Global Intelligence Portal Terms and Conditions, accessible under the following link Portal T&Cs.
Jabil's Global Category Intelligence Archive
Global Category Intelligence
Q4 2024
Jabil's Global Category Intelligence Archive
Global Category Intelligence
Q4 2024
ENERGY
MARKET DYNAMICS
-
Significant losses in global financial markets have dampened optimism about an economic recovery, although one positive sign is the US Federal Reserve’s half-point interest rate cut announced in September.
-
Additionally, the potential escalation of the Iran-Israel conflict into a broader Middle Eastern crisis has emerged as an essential geopolitical risk. This could increase gas prices due to curtailed production in Israel and higher demand for Liquid Natural Gas (LNG) imports from Egypt.
-
The anticipated growth in the world’s electricity demand through 2025 is the most rapid since its post-Covid rebound, presenting significant opportunities and challenges for the energy market.
EUROPE
-
European energy markets this summer were significantly influenced by weather patterns, political events, and market dynamics.
-
Power demand across Europe struggled to recover from last year's levels, contributing to lower spot prices in most markets. The mixed picture persisted in fuel markets, with gas prices gaining due to slow stock builds.
-
In contrast, coal and carbon prices experienced relatively strong losses amid weak Asian demand and cautious market sentiment.
-
Extreme market and weather events further fueled price volatility, alerting market participants to potential tail-risk events.
-
-
Weather conditions remained a key factor in European and global energy markets. Unusually high temperatures in Southeast Europe increased cooling demand, and low precipitation pushed power prices above EUR 500/MWh in some areas.
-
A significant incident occurred on 25 June when a power cut affected IT systems at the European Power Exchange (EPEX SPOT). This led to a rare decoupling of significant markets in Central Northwest Europe. This disruption dictated backup regional auctions, lifting the German baseload spot price to EUR 492/MWh, the highest level since the peak of the energy crisis in September 2022, with hourly prices reaching EUR 2.325/MWh.
-
By contrast, the French spot price cleared at just EUR 2.1/MWh. Although this event does not reflect market fundamentals, it highlights Germany’s high dependency on imports and how abruptly prices can respond to unforeseen events that reduce the country's import capacity.
-
Despite these challenges, European markets have navigated the summer comfortably, avoiding the extremely high prices during previous heatwaves. Additionally, Europe continued to fill gas inventories at an accelerated pace, deflating the risk premium for this winter.
AMERICAS
- In July, a hurricane on the Texas Gulf Coast disrupted LNG markets, underscoring the vulnerability of a region that exports as much gas as Norway, Europe’s top pipeline supplier. Five of America’s seven major LNG plants are located on the Gulf Coast, where every inch is vulnerable to hurricanes. Another five plants or expansions in this region are under construction. This concentration of supply in an area subject to extreme weather events underscores the problem of supply vulnerability.
ASIA
- High temperatures in Northeast Asia boosted energy demand and, in turn, coal prices due to China’s pivotal role in global coal markets. Most Southeast Asian countries now have ambitious long-term clean energy goals, but investments are not yet on track.
- Electricity demand in China is forecast to increase by 6.5%, similar to its average rate between 2016 and 2019. This annual solid growth represents a modest slowdown from 7% in 2023 amid the ongoing restructuring of the Chinese economy. Electricity consumption in 2024 and 2025 is expected to be driven by robust activity in the services industries and various industrial sectors, including a rapid rise in solar photovoltaics (PV), electric vehicle (EV), and battery production, and the electricity-intensive processing of related materials.
DEMAND TRENDS & FORECASTS
GLOBAL DEMAND TRENDS
Global electricity demand is on an upward trajectory, driven by economic growth, technological advancements, and climate-related challenges. According to the International Energy Agency (IEA), it is expected to grow by 4% in 2024, continuing its momentum from a 2.5% rise in 2023.
This increase would represent the highest annual growth rate since 2007, excluding the exceptional rebound from the global financial crisis and the COVID-19 pandemic.
Several key factors are shaping this global demand:
- Economic Growth and Electrification: Rapid economic expansion is a significant driver, particularly in developing economies. Countries such as China and India are witnessing robust increases in electricity demand as they continue to industrialize and expand their technological infrastructure.
- China is forecast to grow 6.5% in 2024, propelled by the production of EVs, batteries, PVs, and other clean energy technologies.
- India is experiencing even higher growth at 8.5%, fueled by industrial activity and rising cooling needs due to severe heat waves.
- Climate Change and Extreme Weather Events: Increasing frequency and intensity of heat waves exert pressure on global electricity systems. In the first half of 2024, multiple regions across the globe faced record temperatures, which elevated electricity demand for cooling.
- The trend will likely continue as global temperatures rise, leading to a surge in the sales of air conditioning units. The IEA projects that the number of air conditioners globally could rise to 5.6 billion by 2050, up from 2 billion in 2023.
- Renewable Energy Integration: Solar PV is becoming a cornerstone of global electricity supply, with the IEA estimating it will meet nearly half of the world’s electricity demand growth in 2024. As the renewable energy transition accelerates, integrating solar and wind energy into national grids continues to expand, reducing reliance on fossil fuels. In many regions, renewables are replacing older, less efficient power plants, particularly coal-fired stations, thus contributing to lower emissions and decarbonization efforts.
- Technological Growth: Emerging technologies, particularly data centers and AI, are becoming prominent contributors to global electricity demand. As industries increasingly digitalize, the energy requirements for data storage, AI training, and computational tasks are rising sharply.
- Data centers are under scrutiny, with projections indicating that their share of electricity consumption could grow from 1.3% in 2022 to as much as 3% by 2026, depending on the pace of AI adoption and sector growth.
- Electric Vehicles (EVs): While the electrification of transport is one of the most transformative trends of the decade, electric vehicles still represent a relatively small share of global electricity consumption.
- In 2022, EVs accounted for around 0.5% of global demand, expected to rise to 1.5%–2% by 2026. Although EV electricity usage remains modest compared to other sectors, such as data centers or primary aluminum production (4% of global electricity), the rapid expansion of EVs is influencing electricity grid planning and infrastructure development in many regions.
- Regional Disparities: Despite the global rise in electricity demand, the growth rate and consumption patterns differ across regions. For example, in Europe, demand is recovering slower after two years of decline, with the IEA forecasting only 1.7% growth in 2024.
- The European Union’s electricity demand is constrained by energy crises, lower economic growth, and an energy efficiency push limiting consumption in industrial sectors.
- In contrast, regions like the United States and India are seeing more robust rebounds, with demand growing at 3% and 8.5%, respectively, in 2024.
- Bottlenecks and Infrastructure Challenges: The expansion of data centers and EV charging infrastructure is creating local bottlenecks in electricity supply, especially in highly urbanized regions.
- For instance, Ireland and Singapore, where data centers represent a substantial share of national electricity consumption (18% and 7% respectively), face grid capacity challenges. Grid modernization, storage, and transmission infrastructure investments will be crucial to accommodating growing electricity demands from dives.
REGIONAL DEMAND DYNAMICS
The dynamics of electricity demand vary significantly across regions, shaped by economic conditions, energy policies, climate factors, and technological advancements. While emerging economies like China and India continue to drive rapid growth due to industrial expansion and rising electrification, more developed regions like the United States and the European Union are experiencing slower yet steady recoveries. Additionally, regional responses to climate change and grid capacity challenges influence energy consumption patterns, leading to distinct trends impacting procurement strategies and supply chain management across different markets.
-
United States: After a 1.6% decline in 2023, predominantly due to mild weather, electricity demand in the United States rose by 3.8% in the first half of 2024. We expect this robust growth trend to continue for the year, with an average annual growth of 3% YoY in 2024 and 1.9% YoY in 2025, indicating a stable and growing market
-
European Union: After two years of contraction due to the energy crisis, demand in the EU is expected to recover modestly by 1.7% in 2024, with growth continuing at a moderate pace into 2025.
-
India: Due to vigorous economic activity and intense heatwaves, electricity demand is forecast to surge by 8% in 2024. Growth may moderate slightly in 2025, but demand will remain significantly above pre-pandemic levels.
-
India's electricity demand surged 8.5% YoY in the first half of 2024, driven by strong economic growth, industrial expansion, and extreme heat waves. This higher growth aligns with the IMF's forecast for India's GDP to average 6.8% in 2024 and 6.5% in 2025.
-
India’s electricity demand is expected to moderate slightly in 2025 but will remain significantly at pre-pandemic levels. The fact that India's per capita electricity consumption is still considerably lower than in the European Union indicates a promising potential for further growth in energy demand as the country continues to develop.
-
-
China: Demand will rise by over 6% in 2024, driven by growth in services and industrial sectors, particularly clean energy technologies. After a 7% YoY increase in 2023, growth will continue at 6.5% in 2024 and ease to 6.2% in 2025.
-
Electricity demand in China is propelled higher by a rapid rise in EV and solar PV production. Following a strong 7% YoY increase in electricity consumption in 2023, growth in China continued at an estimated rate of around 6.5% in the first half of 2024. Demand growth of 6.5% is forecast for the full year before moderately easing to 6.2% in 2025.
-
Despite the expected slowdown in the Chinese economy and the continuing structural shift towards becoming less reliant on heavy industries, the rapidly expanding production of solar PV modules, electric vehicles, batteries, and related materials supports electricity demand growth.
-
SECTOR-SPECIFIC DRIVERS
-
Air Conditioning: The global number of air conditioning units is projected to reach 5.6 billion by 2050, up from 2 billion in 2023, significantly contributing to rising electricity demand.
-
Data Centers: The rise of artificial intelligence (AI) and data centers is attracting attention due to their growing electricity demand. While data centers accounted for 1-1.3% of global electricity consumption in 2022, this is projected to rise to 1.5-3% by 2026.
-
Electric Vehicles (EVs): Despite their rapid growth, EVs consumed only 0.5% of global electricity in 2022, with forecasts suggesting this could rise to 1.5% and 2% by 2026. For comparison, primary aluminum production consumes 4% of global electricity.
EMERGING REGIONAL BOTTLENECKS
-
In some regions, data centers already represent significant electricity demand. For example:
-
Data centers accounted for 18% of Ireland’s electricity consumption in 2022.
-
In Singapore, they made up 7% of national electricity use in 2020.
-
-
Regional bottlenecks are emerging due to the rapid expansion of data centers and growing electrification, which strain power grid connections. In response:
-
Dublin: Grid connection restrictions for new data centers have existed since 2021.
-
Netherlands: Restrictions on hyperscale data centers were introduced in 2023 due to grid constraints.
-
Singapore: A temporary moratorium on new data centers in 2019 was relaxed in 2022.
-
United States: The Federal-State Modern Grid Deployment Initiative, launched in 2024, is focused on upgrading grids to handle demand from large data centers. Regions like Virginia and Texas face particular strain.
-
-
Solar PV and wind energy are at the forefront of this transformation, with their combined share anticipated to rise from 13% in 2023 to 15% in 2024 and 18% in 2025 – up from a mere 4% a decade earlier. Wind and solar PV generation are expected to provide an additional 750 TWh in 2024 and more than 900 TWh in 2025.
-
Globally, electricity generation from solar PV and wind generation is set to surpass that from hydropower in 2024, marking a pivotal moment for the sector.
-
Global gas-fired generation growth is forecast at an average of 1% in 2024 and 2025, as solid declines in Europe are offset by increases in the Middle East due to continued switching from oil- to gas-fired generation and in Asia amid rising LNG imports.
-
Nuclear generation is expected to grow by 1.6% in 2024 and 3.5% in 2025 as the maintenance of the French nuclear fleet progresses and new reactors in China, Korea, and Europe, as well as restarted ones in Japan, become operational.
-
Fossil-fired generation fell in the EU but rose in India, China, and the US in the first half (H1) of 2024
-
After being affected by droughts three years in a row, hydropower output in China started to rebound in H1 2024, with an increase of 21% YoY. Solar PV generation is estimated to have increased by over 35% during the same period.
-
Wind generation was up by 7%. Despite this, coal-fired power remained resilient and grew by an estimated 1.5% in H1 2024, driven by robust electricity demand in China.
EUROPE
-
Strong French nuclear production and robust hydropower output in Switzerland and the Nordics provided upward system flexibility and prevented further price increases.
-
French nuclear generation recently reached the upper end of the 2016-2023 range, with only minor production curtailment due to river temperature issues. Notably, only one French nuclear reactor was affected by high river temperatures this July, a significant improvement compared to previous summers when multiple reactors in southern France were impacted. However, in early August, Électricité de France (a French multinational electric utility company) warned of potential heat-related output reductions at four nuclear power plants in southeastern France, highlighting their high sensitivity to further increases in river temperatures.
-
Meanwhile, hydro stocks in Switzerland rose by more than 10% points above the five-year average in July, boosting hydro utilization rates. This increase is probably driven by more robust exports to Italy amid French transmission system operator RTE’s announcement of reduced exports eastward. This decision has widened France-Italy forward price spreads for August and September. Looking ahead, temperatures in southeast Europe are expected to remain above average, supporting power price peaks, while strong precipitation in the Nordics will limit any possible price hikes.

SUPPLY ANALYSIS
ELECTRICITY
- Renewable generation will overtake coal-fired power in 2025. Renewable sources of electricity are set to expand rapidly this year and next, with their share of global electricity supply forecast to rise from 30% in 2023 to 35% in 2025. The amount of electricity generated by renewables worldwide in 2025 is forecast to eclipse the amount generated by coal for the first time. Solar PV alone is expected to meet roughly half of the growth in global electricity demand over 2024 and 2025 – with solar and wind combined meeting as much as three-quarters of the growth.
- Despite the sharp increases in renewables, global power generation from coal is unlikely to decline this year due to the strong growth in demand, especially in China and India (Source: IEA (2024), Electricity Mid-Year Update - July 2024). As a result, carbon dioxide (CO2) emissions from the global power sector are plateauing, with a slight increase in 2024 followed by a decline in 2025.
- However, considerable uncertainties remain: Chinese hydropower production recovered strongly in the first half of 2024 from its 2023 low. If this upward trend continues in the second half of the year, it could curb coal-fired power generation and slightly decline global power sector emissions in 2024.
- Solar PV and wind energy are at the forefront of this transformation, with their combined share anticipated to rise from 13% in 2023 to 15% in 2024 and to 18% in 2025 – up from a mere 4% a decade earlier. Wind and solar PV generation are expected to provide an additional 750 TWh in 2024 and more than 900 TWh in 2025.
- Globally, electricity generation from solar PV and wind generation is set to surpass that from hydropower in 2024, marking a pivotal moment for the sector.
- Global gas-fired generation growth is forecast at an average of 1% in 2024 and 2025, as strong declines in Europe are offset by increases in the Middle East due to continued switching from oil to gas-fired generation and in Asia amid rising LNG imports.
- Nuclear generation is expected to grow by 1.6% in 2024 and 3.5% in 2025 as the maintenance of the French atomic fleet progresses and new reactors in China, Korea, and Europe, as well as restarted ones in Japan, become operational.
- Fossil-fired generation fell in the EU but rose in India, China, and the US in the first half (H1) of 2024.
- After being affected by droughts three years in a row, hydropower output in China started to rebound in H1 2024, with an increase of 21% YoY. Solar PV generation is estimated to have increased by over 35% during the same period.
- Wind generation was up by 7%. Despite this, coal-fired power remained resilient and grew by an estimated 1.5% in H1 2024, driven by robust electricity demand in China.
EUROPE
- Strong French nuclear production and robust hydropower output in Switzerland and the Nordics provided upward system flexibility and prevented further price increases.
- In recent weeks, French nuclear generation reached the upper end of the 2016-2023 range, with only minor production curtailment due to river temperature issues. Notably, only one French nuclear reactor was affected by high river temperatures this July, a significant improvement compared to previous summers when multiple reactors in southern France were impacted. However, in early August, EDF warned of potential heat-related output reductions at four nuclear power plants in southeastern France, highlighting their high sensitivity to further increases in river temperatures.
- Meanwhile, hydro stocks in Switzerland rose by more than 10% points above the five-year average in July, boosting hydro utilization rates. This increase is probably driven by stronger exports to Italy amid French transmission system operator RTE’s announcement of reduced exports eastward. This decision has resulted in widening France-Italy forward price spreads for August and September. Looking ahead, temperatures in southeast Europe are expected to remain above normal, supporting power price peaks, while strong precipitation in the Nordics will limit any possible price hikes.
PRICING TRENDS & INSIGHTS
Wholesale electricity prices remain regionally divergent. In some markets, energy commodity prices eased slightly in early 2024, contributing to lower wholesale power costs. However, extreme heatwaves and regional factors influence prices, with some markets exceeding pre-2021 levels.
EUROPE
- European gas prices dropped due to high inventory levels, increased supply from Norway and the UK, and the prospect of gas transit via Ukraine continuing in 2025, with Azerbaijan replacing Russian flows.
- However, European LNG send-out remained stable and remains a significant bullish risk, given the continent’s high dependence on LNG imports, competition with Asia for winter restocking, and the North Atlantic hurricane season.
- EU Emissions Trading System allowance prices traded sideways against persistently weak industrial demand and ample low-carbon power generation. Slightly lower than expected sales volumes from the EU’s innovation and modernization funds in 2025, among other developments, support our bullish long-term outlook.
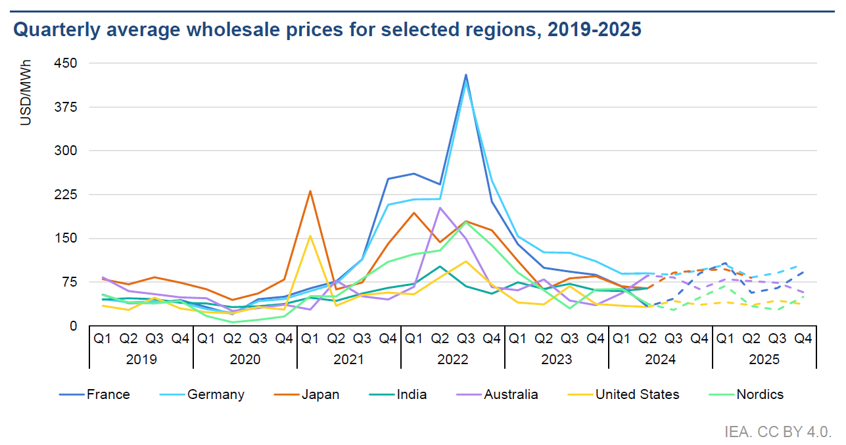
- Gas drives electricity prices higher in Europe; however, wholesale electricity prices declined in most European markets, including France and Germany, in the first half of 2024. The average price in Europe was ~70€/MWh, falling back to the H1 2021 level but remaining 40% above the H1 2019 average.
UNITED STATES
- In the United States, wholesale electricity prices averaged around USD 30/MWh in the first half of 2024, down almost 15% compared to the same period in 2023. Prices in the year's first six months reached levels last seen during the first half of 2019.
- Despite experiencing an average mild winter, the United States faced short-term extreme weather conditions and spikes in electricity prices in some states, such as New York and New England, due to the freezing of natural gas wells in early 2024.
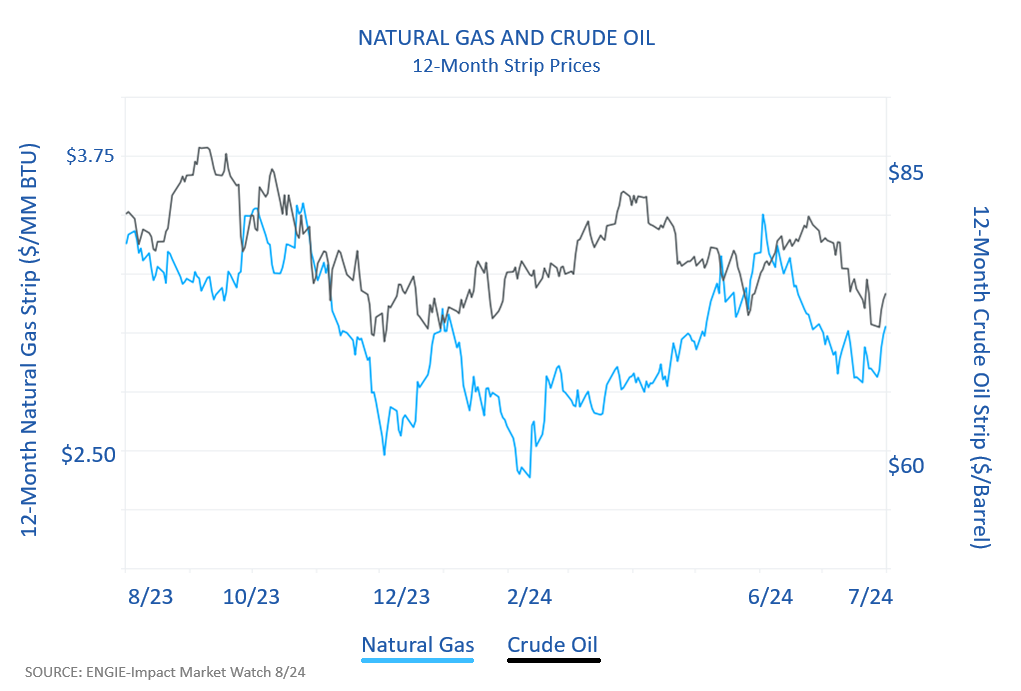
- At the beginning of June, the United States natural gas pricing on the NYMEX Henry Hub was at its highest price since 2024: USD 3.5 / MMBtu. Since then, the price has sharply declined and is now down to less than USD 3 / MMBtu on average.
KEY TAKEAWAYS
Supply Chain and Procurement Implications
As electricity demand grows globally, indirect procurement strategies must account for volatile energy prices and supply chain constraints. The rising demand for renewable energy sources, grid modernization projects, and energy-efficient technologies will drive procurement opportunities in energy services, infrastructure projects, and materials essential for energy storage solutions. Suppliers and buyers must anticipate and navigate potential disruptions caused by regional bottlenecks, regulatory shifts, and increasing demand for key energy resources.
Geopolitical and Macroeconomic Risks:
- The potential escalation of the Iran-Israel conflict into a broader Middle Eastern crisis could lead to significant volatility in energy markets, particularly by driving up gas prices due to production disruptions and increased demand for LNG imports in Europe.
- Global financial market instability and the US Federal Reserve's reluctance to cut interest rates significantly dampen hopes for an economic recovery, which may influence energy market conditions.
Regional Energy Market Dynamics:
- Europe: Weather patterns and political events continue to create price volatility. For instance, July saw unusually high temperatures in Southeast Europe, driving power prices above €500/MWh in some regions. Despite these challenges, European markets have managed to maintain stability, partly due to robust gas inventory builds.
- Americas: The concentration of LNG plants on the Gulf Coast presents a supply vulnerability, particularly in the face of hurricanes, as seen with Hurricane Beryl. This underlines the importance of geographic diversification in supply chains.
- Asia: Rising temperatures and economic activity in China and India push the electricity demand stance, and July and coal prices are higher. The shift towards renewables is gaining momentum, though investment levels remain below targets in Southeast Asia.
Global Electricity Demand and Renewable Growth:
- Electricity demand is projected to grow at one of the fastest rates in two decades, with solar PV expected to meet half of this increase. By 2025, renewable energy generation is anticipated to surpass coal, marking a significant shift in global energy dynamics.
- The rise of electric vehicles, AI, and data centers is driving substantial increases in electricity consumption, with potential grid challenges emerging, especially in regions with high data center concentration.
Pricing Trends and Forecasts:
- Wholesale electricity prices in Europe and the US have generally decreased compared to 2023 but remain above pre-2021 levels. This trend is influenced by increased renewable generation and stable gas supply, though localized events like extreme weather continue to cause price spikes.
- High inventory levels and diversified supply sources influence European gas prices. Still, risks remain due to the region's dependence on LNG imports and geopolitical factors like the North Atlantic hurricane season.
Infrastructure and Regulatory Developments:
- The growing demand for electricity from data centers and AI applications highlights the need for significant investments in power grid infrastructure. Regulatory initiatives in the EU and the US aim to improve data collection and sustainability reporting, which could impact procurement strategies and compliance requirements.
Recommendations
- Diversify Energy Sources: Explore alternative energy options to reduce reliance on traditional sources and lower costs.
- Develop a Long-Term Strategy: Create a comprehensive energy plan to mitigate market volatility, including renewable energy certificates (RECs), on-site/off-site generation, and power purchase agreements. Manage Risk: Assess risk exposure and consider fixed-price contracts to hedge against potential price spikes.
- Act Now: Current market conditions may favor securing energy contracts, but be mindful of potential price fluctuations.
Back to Top