

By clicking the “I Accept” button, or by accessing, participating, or submitting any information, or using the Jabil Global Intelligence Portal or any of its associated software, you warrant that you are duly authorized to accept the Global Intelligence Portal Terms and Conditions on behalf of your Company, intending to be legally bound hereby, and your company shall be bound by the terms and provisions of the Global Intelligence Portal Terms and Conditions, accessible under the following link Portal T&Cs.
Jabil's Global Category Intelligence Archive
Q3 2022
Jabil's Global Category Intelligence Archive
Q3 2022
ENERGY
ENERGY OVERVIEW
Market Dynamics
Global
- The projected peak in demand for fossil fuels continues to move forward; demand for oil is projected to peak in the next five years.
- While governments and businesses are increasingly committed to steep decarbonization targets, energy markets face extreme volatility driven by geopolitical tensions and a rebound in energy demand.
- The global energy landscape has been impacted by increased market uncertainty due to the conflict in Ukraine. Already before the conflict began, the rebound in energy demand triggered supply constraints and price spikes for multiple commodities. Additionally, the long-term shift to low-carbon energy systems continues to gain momentum and has been accelerating in several respects.
- Electricity demand is projected to triple by 2050 as sectors electrify and hydrogen-based fuels increase their market share due to decarbonization.
- The conflict in Ukraine is leading to price spikes as the market and consumers balance supply security and affordability.
- Throughout 2021, global energy demand and emissions increased by 5% compared to 2020, almost reaching pre-COVID-19 levels (~33 Gt energy-related CO₂ equivalent).
Europe
- European demand has been the most affected by the Ukraine/Russia conflict and has created the need for industry to be more agile and risk averse with energy purchasing to ensure supply for business is not jeopardized.
- Countries and businesses are investing more heavily in long-term, clean energy generation to ensure the security of supply whilst aiding GHG emissions targets.
- Power Purchase Agreement (PPA) market, both physical and virtual, is evolving and becoming more common place across EU countries. These PPA’s and VPPA’s are becoming more prevalent due to their stability in the current volatile energy environment.
- The key benefits of these agreements are that they offer long term stability for companies as they are typically between 10 and 20 years long. Another benefit is that they are 100% from renewable assets.
- The difference between a PPA and a VPPA is a Virtual PPA is a multi-year bilateral renewable energy contract that does not involve the physical delivery of energy from the vendor to the customer, who thus does not need to change supplier. These agreements are ideal for multiuse customers, as no specific supply points are involved.
- Green Certificates for electricity are also becoming increasingly attractive for businesses who are seeking to reduce their Green House Gas (GHG) emissions. A green certificate verifies that the electricity that is being consumed at a site is from a renewable energy source rather than a carbon emitting source. These certificates differ in name across the globe including GOs, ROCs, RECs.
Asia
- Growth is forecast to resume pre-pandemic trends across all demand sectors during 2021 – 2024, with a slowing year on year positive growth.
- Slower electricity demand between 2022 and 2024 means that approximately two thirds of the net demand increase in the region is forecast to be covered by renewables, followed by coal covering 27% of demand growth and nuclear covering 7%.
- According to China’s National Bureau of Statistics, coal accounted for 56% of the country’s total energy consumption in 2021. The ratio signifies a continuous decline from more than 70% in the mid-2000s. Nevertheless, the absolute level of China’s coal use has continued to rise.
- This reduction in coal for China’s total energy consumption as a percentage is attributed to the increase in alternative sources in the mix, primarily renewables. China’s installed solar and wind energy capacity now accounts for 35-40% of the global total. According to the International Energy Agency, China is expected to reach 1,200 gigawatts of total wind and solar capacity in 2026 – four years earlier than its current target of 2030.
America
- Demand is beginning to be strongly influenced by the hot weather. Demand for cooling services has a significant impact on the demand for Americas.
- Natural gas traders will closely monitor the weather forecast for signs of early season heat for the potential of strong cooling demand.
- Geopolitics, crude oil market and natural gas production are also driving pricing up for the region.
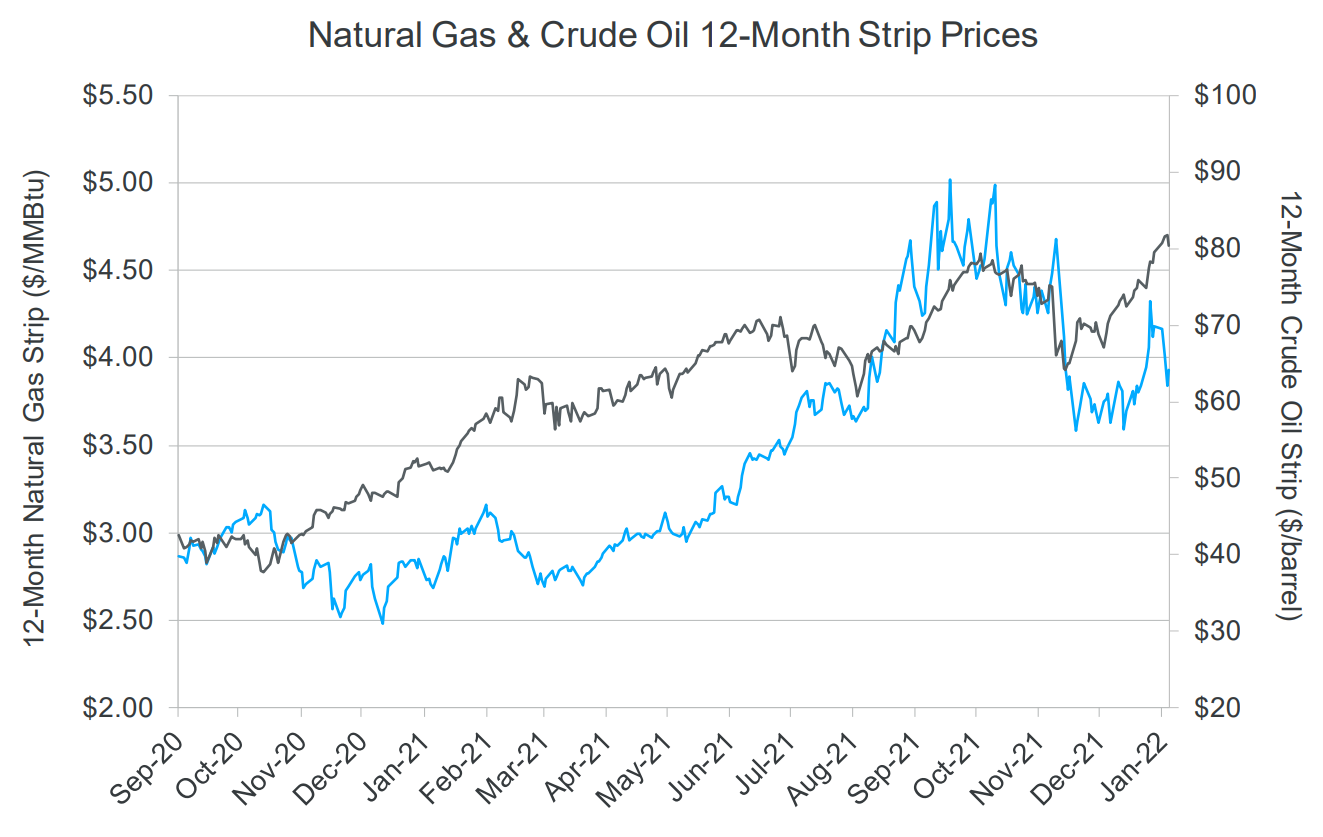
Figure 1: ENGIE-Impact-Market-Watch-1-25-2022.pdf (engieimpact.com)
- However, to combat these raising prices, in the first quarter of 2022, the Federal Energy Regulatory Commission (FERC) approved three projects intended to increase US natural gas exports via pipeline and as liquefied natural gas (LNG). The tracker also lists pipelines that were completed last quarter.
- These new pipeline projects in 2022 supplement the 14 completed petroleum liquids pipelines projects by pipeline companies in the United States, according to the recently updated Liquids Pipeline Projects Database. This total includes seven crude oil pipeline projects and seven hydrocarbon gas liquids pipeline projects; no petroleum product pipeline projects were completed last year.
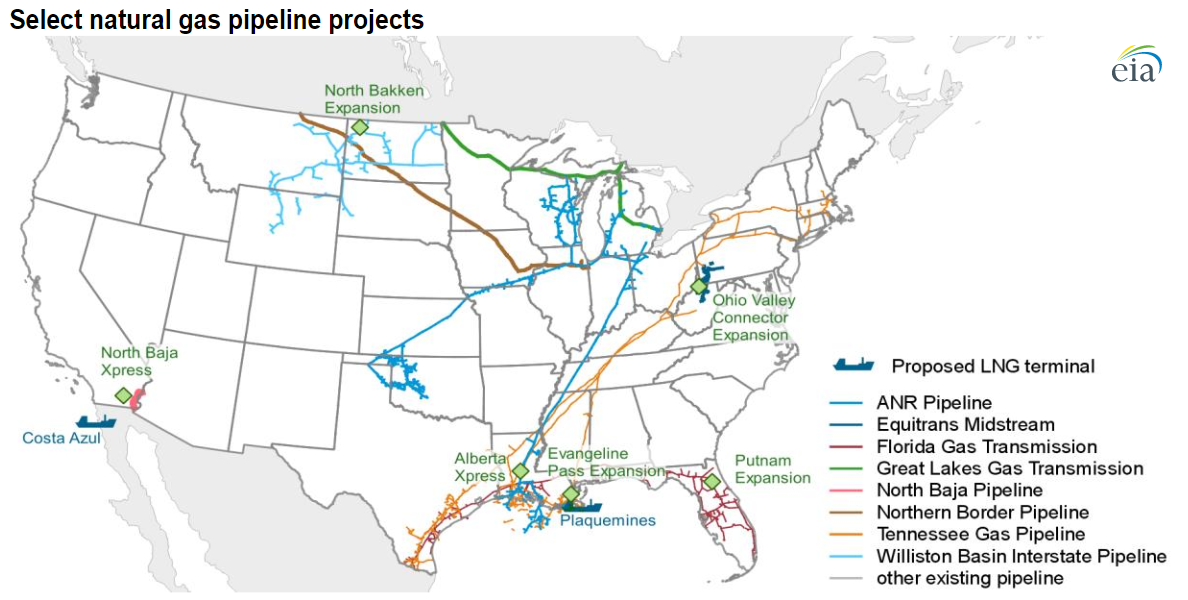
Figure 2: U.S. Energy Information Administration - EIA - Independent Statistics and Analysis
Supply Commentary
Global
- Going forward, the energy mix is projected to shift towards power. By 2050, electricity and enabling hydrogen and synfuels could account for 50% of the energy mix.
- Total investments across energy sectors are projected to grow by more than 4% per annum and are projected to be increasingly skewed towards non-fossil and decarbonization technologies, while returns remain uncertain.
- Geopolitical issues in Russia and Ukraine, as well as other factors, have triggered significant peaks in energy prices as uncertainties around supply security and affordability are paramount. This comes at a time where markets are already tight following the COVID-19 rebound.
- The number of smaller energy suppliers going bankrupt is increasing due to the significant increase in the wholesale energy prices. This results in suppliers needing to pay out more money than they can afford to facilitate their customers which they are unable to absorb. The reliable option to select in these conditions is to partner with a large energy operator or a state backed entity to avoid risk of security of supply.
Europe
- The EU has agreed to ban most Russian oil imports, creating significant disruption in the supply of oil and gas.
- The lack of supply from Russia is forcing countries to import oil and gas supplies from other countries further from Europe such as North Africa and North America. This has led to price increases and transportation challenges.
- Prior to the crisis in Ukraine, Europe had a large dependency on Russia for its gas supply. Natural gas contributes to 20% of Europe’s primary energy consumption, as well as 20% of all electricity generation, heating, and industrial processes. Europe has been steadily increasing its dependence on Russia for its gas supply – in 2020, 44% of all European gas was imported from Russia, whereas, in the fourth quarter of 2021 53% was imported from Russia.
Asia
- As a result of China’s pledge to stop support for new coal projects, 15 projects have been cancelled so far, but grey areas remain7*
- After years of planning and trialing, China has officially launched a national carbon trading market. This is called the national emissions trading scheme (ETS). This is similar to the ETS that the EU launched 15 years ago (the world’s first emissions trading market).
- This scheme should enable China to manage and control CO2 emissions whilst facilitating decarbonization of its economy.
America
- Working gas in underground storage levels against the 5-year average. The graph below represents this trend.
- The shaded area represents the maximum and minimum values over the past 5 years. The purple line is the 5-year average, and the blue line indicates the historic current level for the date.
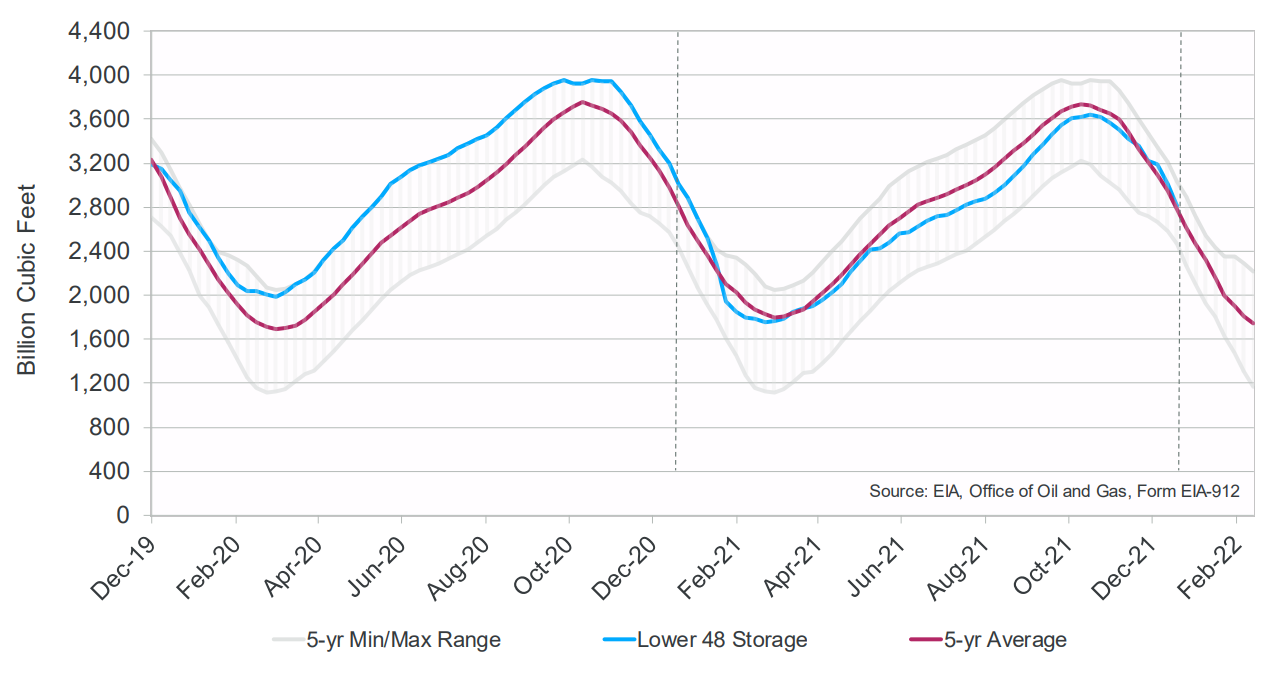
Source: ENGIE-Impact-Market-Watch-5-23-2022
Pricing
America
- Electric ATC 12-Month Rolling Strips
- This graph shows the historic trading range of the electric around the-clock (ATC) 12-month rolling strip by Independent System Operator (ISO) region as of the market close on May 20, 2022.
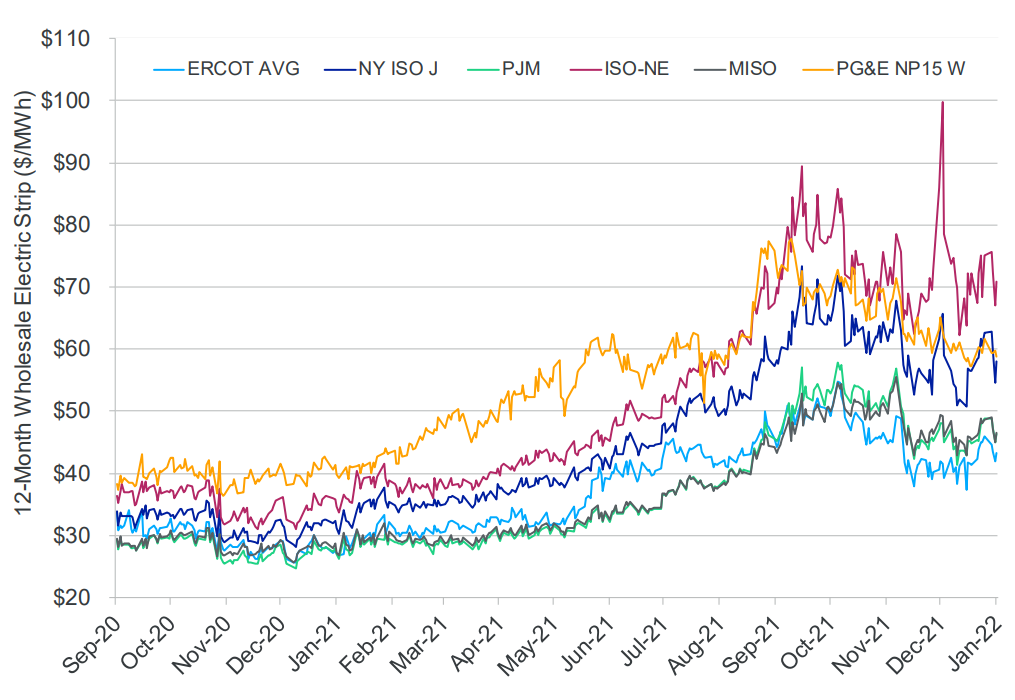
Figure 4: source: ENGIE-Impact-Market-Watch-5-23-2022
- This graph represents the futures trading range of each NYMEX natural gas contract over the past two years.
- The highs and the lows for each month have been provided below, along with the current forward prices as of the market close on May 20, 2022.
- The forecasted future pricing is based on the natural gas reserve levels. As stated above, these are currently at a low, which is driving up the current and forecasted pricing predictions.
Europe
- Europe has seen a consistent increasing trend in energy purchase pricing.
- Pricing is experiencing levels of 4 to 5 times pre-pandemic pricing across Europe.
- The primary cause of this increase is the conflict in Ukraine as mentioned previously. After the new agreement for the EU to ban most Russian imports, this trend is forecasted to continue for at least the next 2 quarters before it potentially returns lower and levels off.
- The new levelling off pricing forecast for later this year or into 2023 is forecast to still be significantly above the pre-pandemic energy prices.
- The graphs below represent the current futures market. These are the current prices for power for future delivery and are susceptible to change.
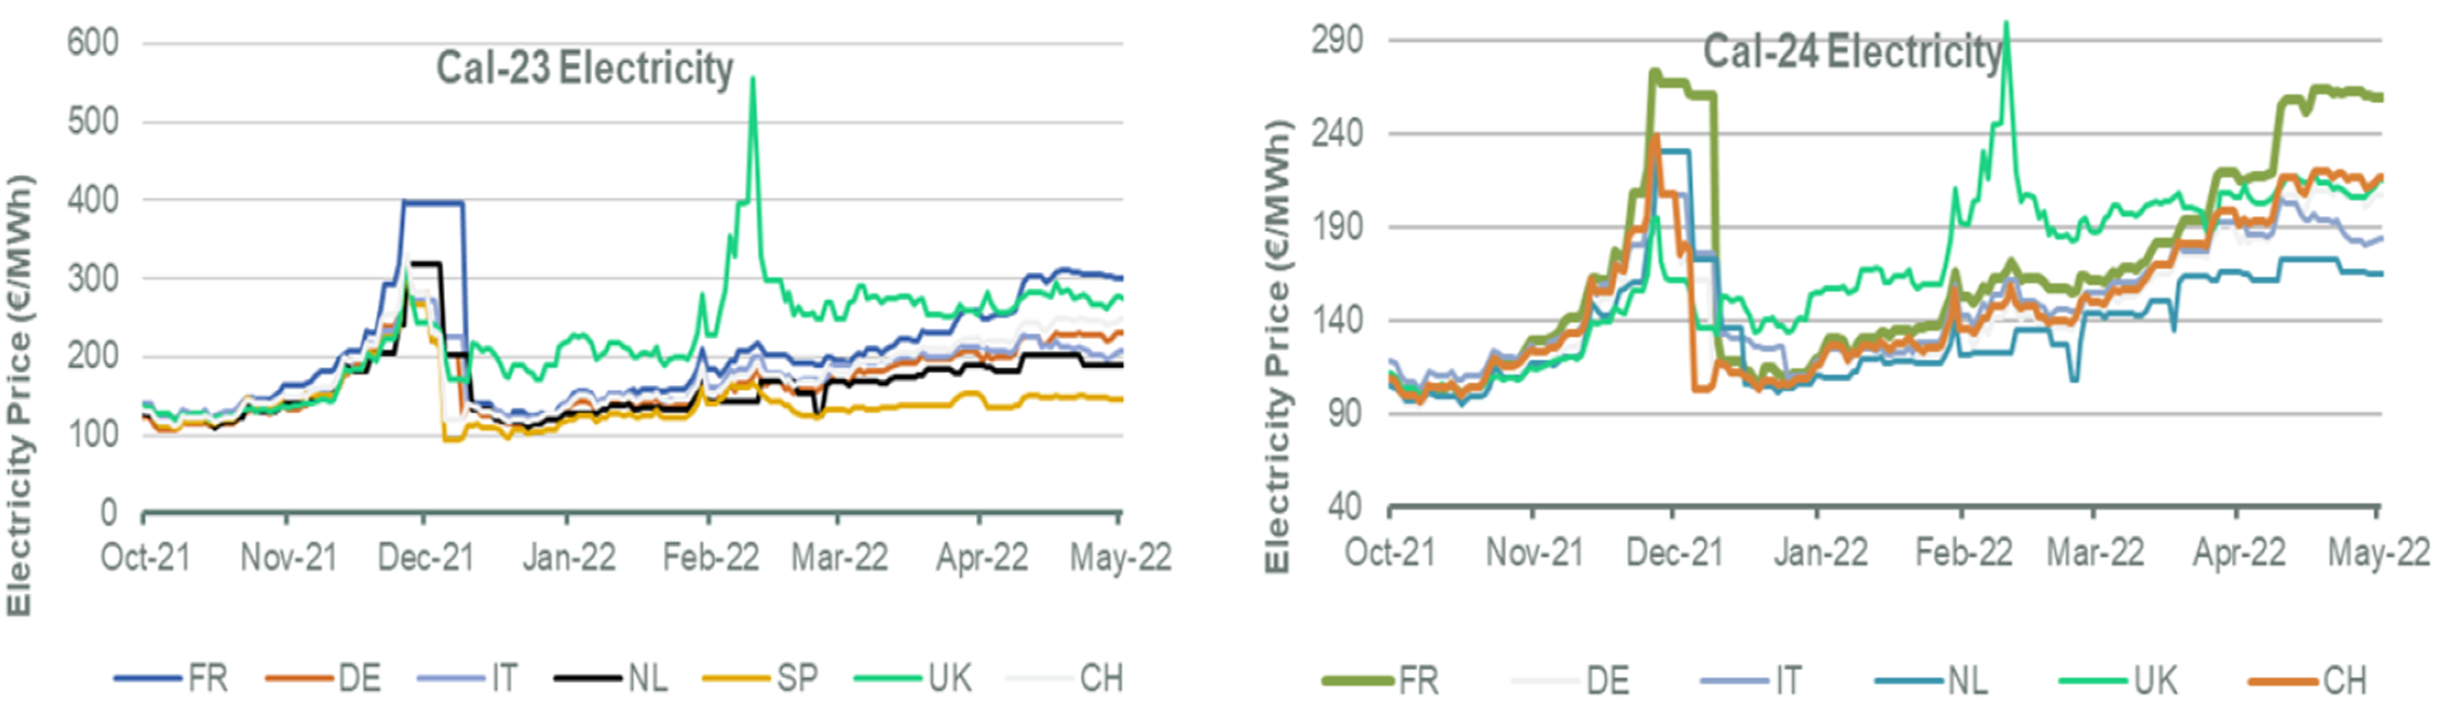
Figure 6: source: Engie Impact European Report 27 May 2022
Asia
- Electricity tariffs in China remain largely regulated, however this is forecast to begin changing in the coming years. On-grid tariffs for industrial and commercial consumers of electricity from coal-fired generation contain a variable part that floats with the coal price. Initially, the variable element was neither allowed to rise above 10% nor drop below 15% of the regional base price.
- Following the coal price surges during summer 2021, there have been net losses for coal power plants. In October, the authorities decided to allow the variable part of the tariff to float up to 20% above the price benchmark (up from 10%).
- Since September 2021, the two grid operators in China, State Grid Corporation of China, and China Southern Power Grid, have been piloting green electricity trading in response to demand for clean electricity from corporations. Under this scheme, corporations bid an energy price and a “green premium” on the power exchanges and establish direct contracts with renewable producers 1 month to 10 years ahead of delivery.
Global
- Current recommendations are to mitigate price volatility where possible. This can be achieved through:
- Locking in contracts to avoid paying the peak prices in electricity that are being forecast.
- Utilizing smart, agile energy procurement strategies: using tranches to lock in prices for quarters or until a time where the spot market price exceeds the tranche price a company is comfortable paying so this price cannot be exceeded for your contract.
- This strategy allows a business to benefit from dips in the market yet not be affected by significant increases. Hedge a proportion of full consumption only – this allows the purchaser to have a reduced proportion of consumption exposed to market conditions.
- Purchase long term PPA’s and/or VPPA’s to secure renewable supply for long-term and mitigate any risk from the market and GHG emitters.
- On-site generation: be fully in control of renewable assets and benefit from clean, energy. Additional benefit includes that excess electricity produced can be exported back to national grid, if sufficient capacity exists.
Key Takeaways
- Keep in continual communication with electricity providers and assess the market conditions frequently.
- Establish if there are any alternative options available that could benefit the business to reduce consumption.
- Implement a longer-term energy strategy to create benefits that will reduce exposure to market volatility. Examples include a staged strategy with a combination of purchasing REC’s, on-site energy generation, off-site energy generation, PPA and VPPA.
- Ensure that the risk being exposed to is manageable. If it is not, fix pricing where possible to mitigate unmanageable risk.
Back to Top