

By clicking the “I Accept” button, or by accessing, participating, or submitting any information, or using the Jabil Global Intelligence Portal or any of its associated software, you warrant that you are duly authorized to accept the Global Intelligence Portal Terms and Conditions on behalf of your Company, intending to be legally bound hereby, and your company shall be bound by the terms and provisions of the Global Intelligence Portal Terms and Conditions, accessible under the following link Portal T&Cs.
Jabil's Global Commodity Intelligence Archive
Global Commodity Intelligence
Q3 2023
Jabil's Global Commodity Intelligence Archive
Global Commodity Intelligence
Q3 2023
METALS & MATERIALS
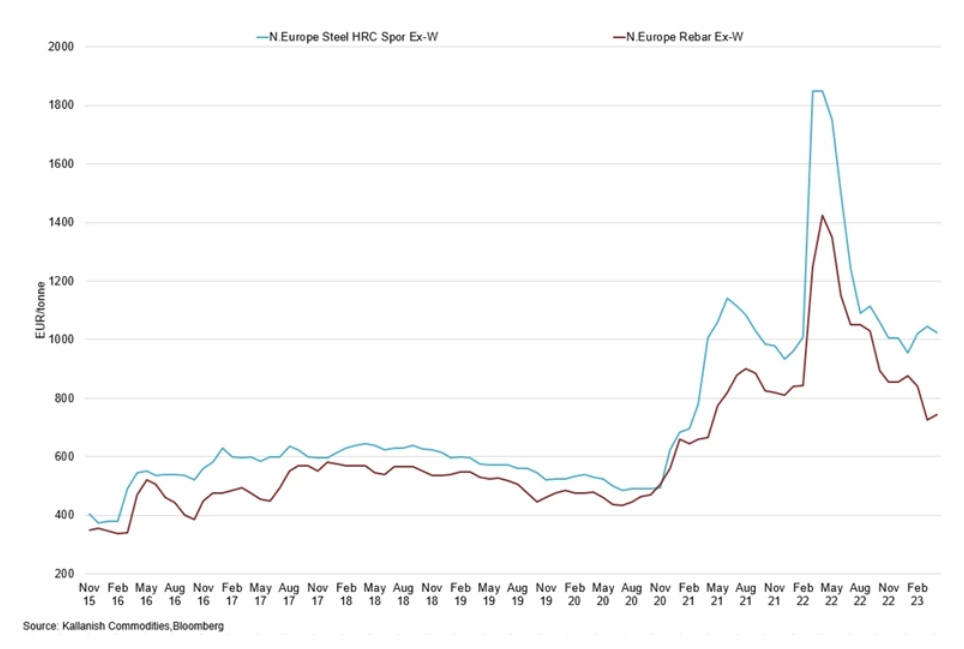
FERROUS METALS
- Steel and iron ore prices sold off, weighing on iron ore and steel demand.
- Given the low-profit margins, stainless steel smelters were forced to cut output.
- Some steel mills with low inventory could restock after the holidays, bringing domestic concentrate stocks slightly lower.
- Steel and iron ore prices sold off as optimism around China's economy re-opening faded sharply, weighing on iron ore and steel demand.
- Expectations over weaker concentrate demand weighed on local prices, but some de-stocking of ore took place ahead of the national holidays.
- Steel and iron ore prices sold off as optimism around China's economy re-opening faded sharply, weighing on iron ore and steel demand.
- Expectations over weaker concentrate demand weighed on local prices, but some de-stocking of ore took place ahead of the national holidays.
Iron Ore Price Index
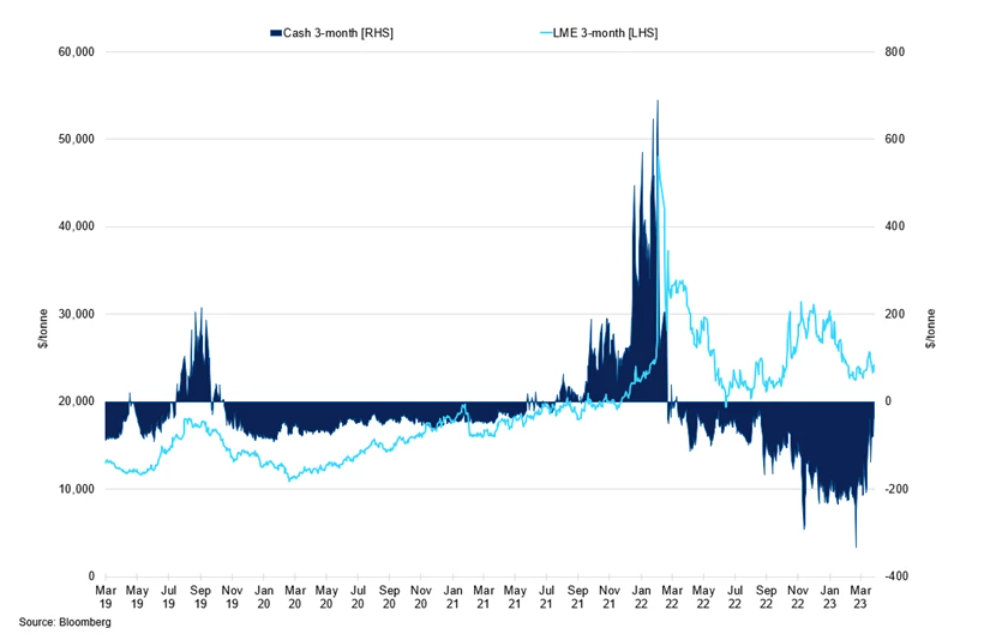
NON-FERROUS METALS: NICKEL
- Weaker demand fundamentals from the stainless-steel segment, although we have seen some recovery in Q2.
- China's nickel ore at seven ports declined slightly, back to 663,870wmt, in the week ending May 1st.
- With the drop in nickel prices in April, nickel ore prices in China also fell, and NPI plants were less willing to buy out of caution of additional price declines.
- Nickel sold off at the start of the year, falling by 23% YTD, weighed down by concerns about weak demand and rising output from Indonesia, despite low exports out of the region.
- Ore demand in China remained slack; thus, the port arrivals were slower than expected. We saw China's nickel ore at seven ports decline slightly.
- Some restocking is set to take place from June/July, as the supply of ore will outweigh the demand recovery.
- Nickel sold off at the start of the year, falling by 23% YTD, weighed down by concerns about weak demand and rising output from Indonesia, despite low exports out of the region.
- While we still hold our optimistic view of recovery, the positive momentum is being priced further down the curve. Range: $20,950-25,950/t
LME PRICE INDEX - NICKEL
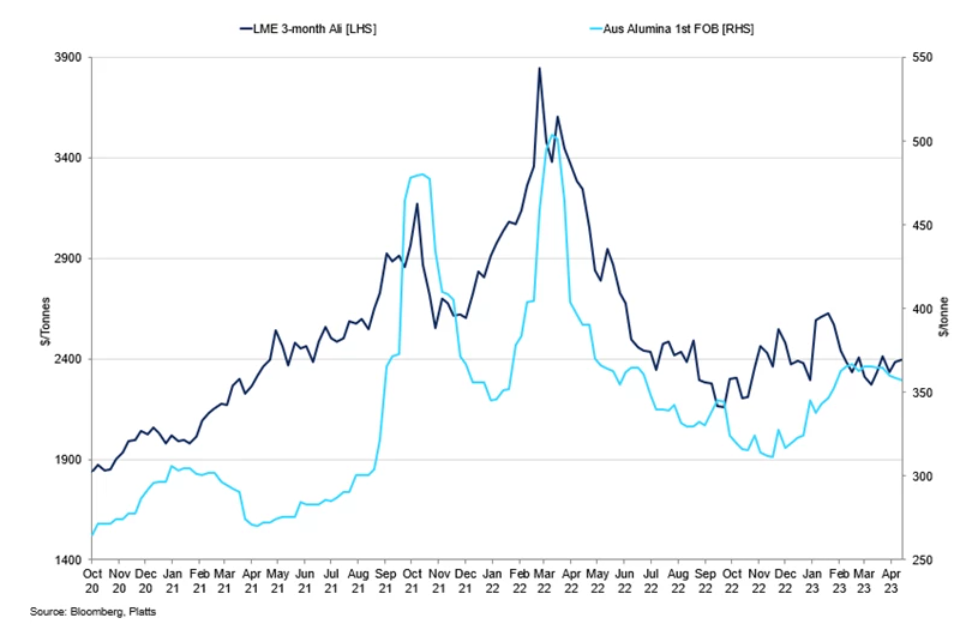
NON-FERROUS METALS: ALUMINIUM
- LME stocks have improved recently but remain at 2005 lows.
- As alumina plants in Shanxi and Henan are unwilling to resume or increase production due to poor profitability and bauxite shortages, the total alumina output is estimated at 6.54m mt in April, down 4% year on year.
- Demand for aluminum is improving but remains low.
- The continued lack of hydropower should not yet weigh on aluminum production.
- We expect the Chinese property market has bottomed out and will continue to slowly recover.
- Recycling represents roughly 35% of global aluminum production and only requires about 8% of the energy required for aluminum production. This is projected to boost demand for various aluminum components in automobiles over the coming years.
- Physical demand for aluminum is improving but remains low. We expect any positive news from China to exacerbate price gains.
- Range: $2,150-2,500/ton
Aluminum Price Index
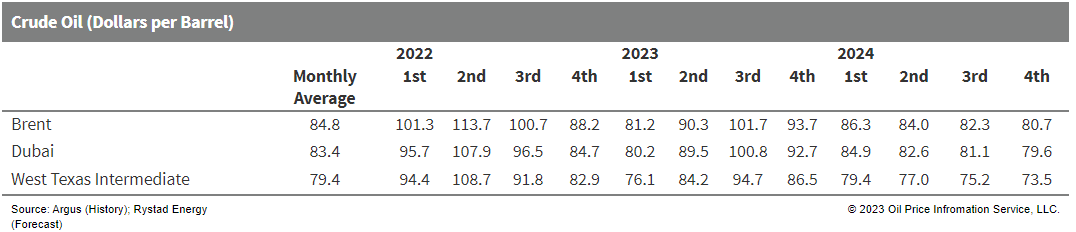
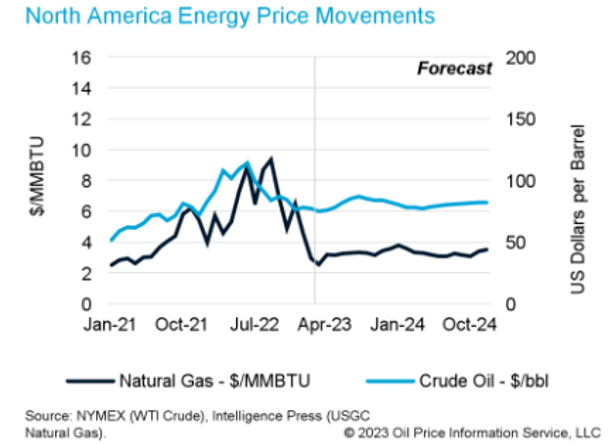
CRUDE OIL PRICING
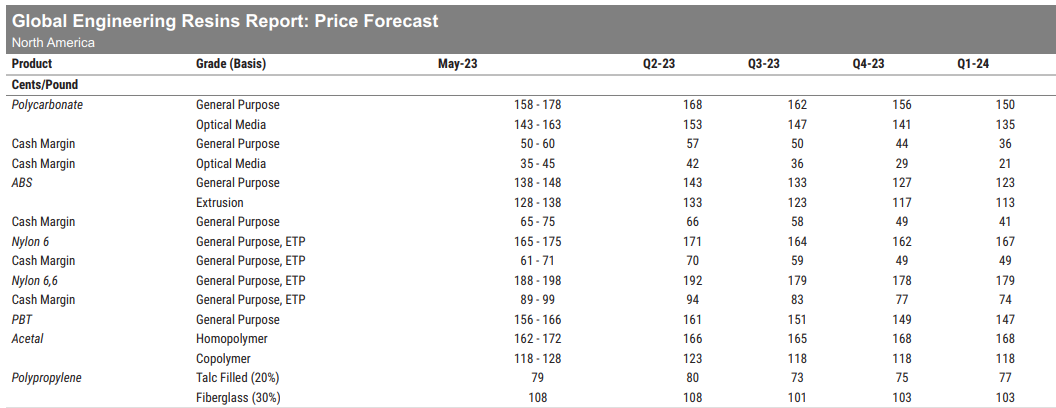
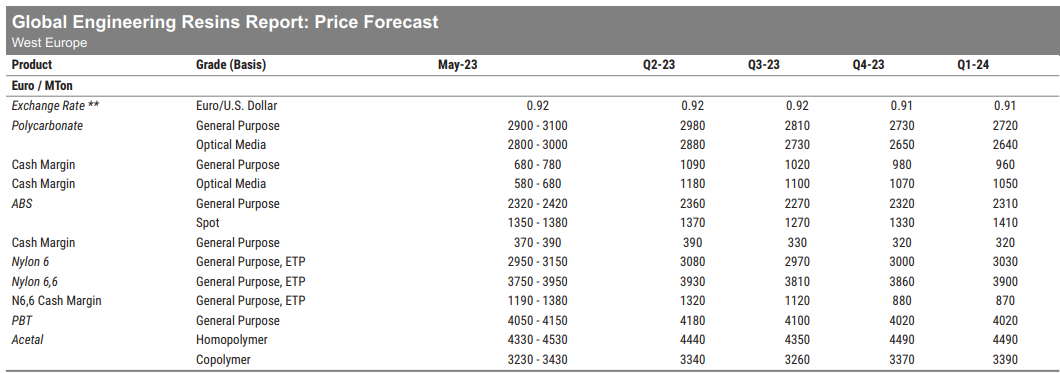
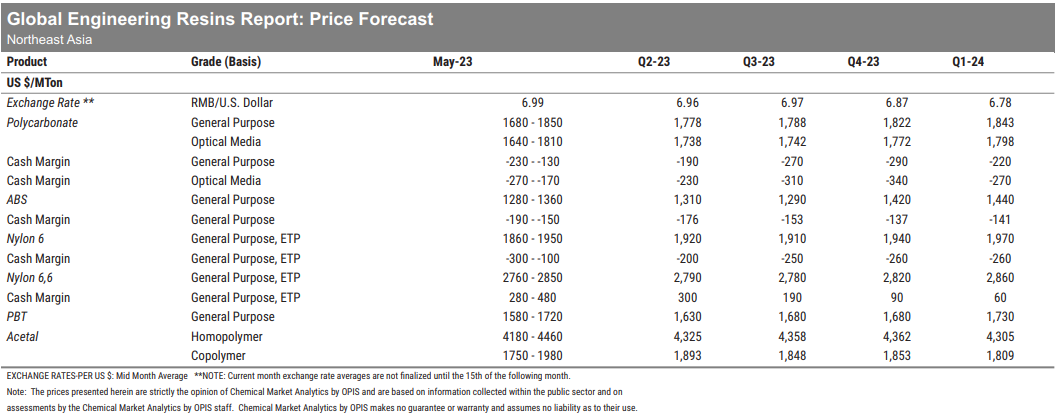
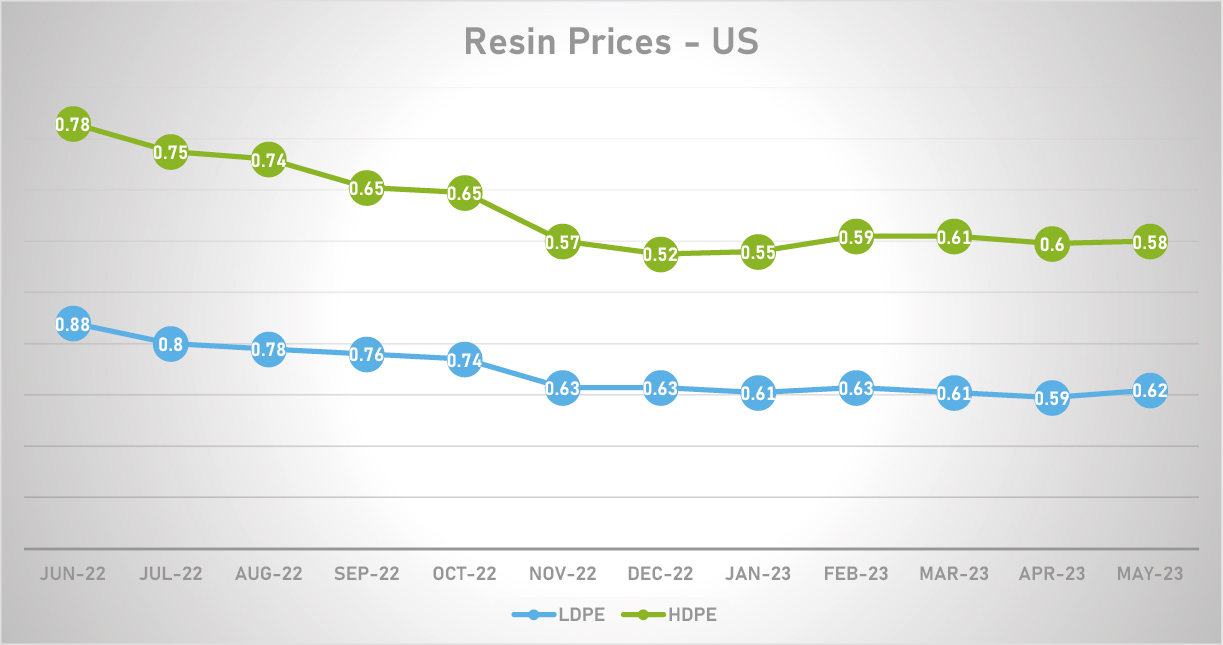
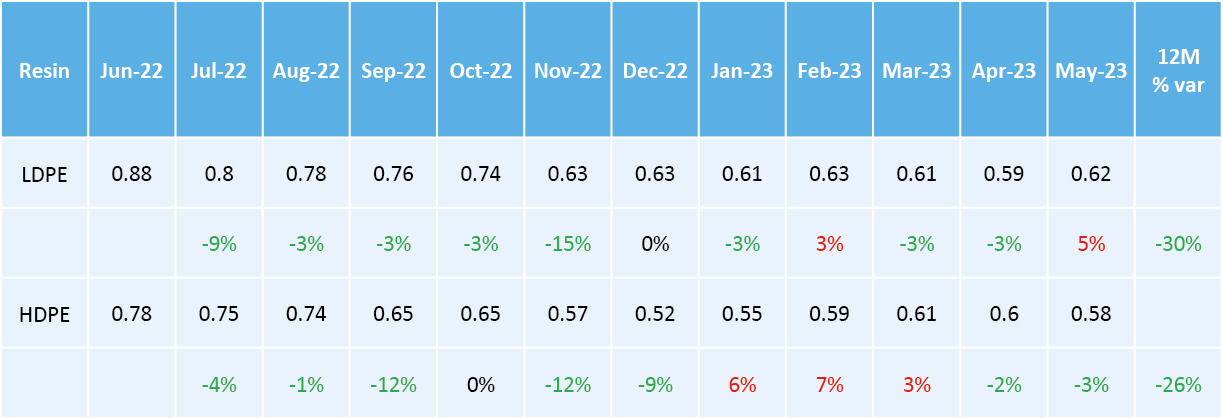
OUTLOOK FOR ENGINEERED RESINS
ECONOMY AND ENERGY
WTI price is USD 73.32 per barrel as of 29th May 2023
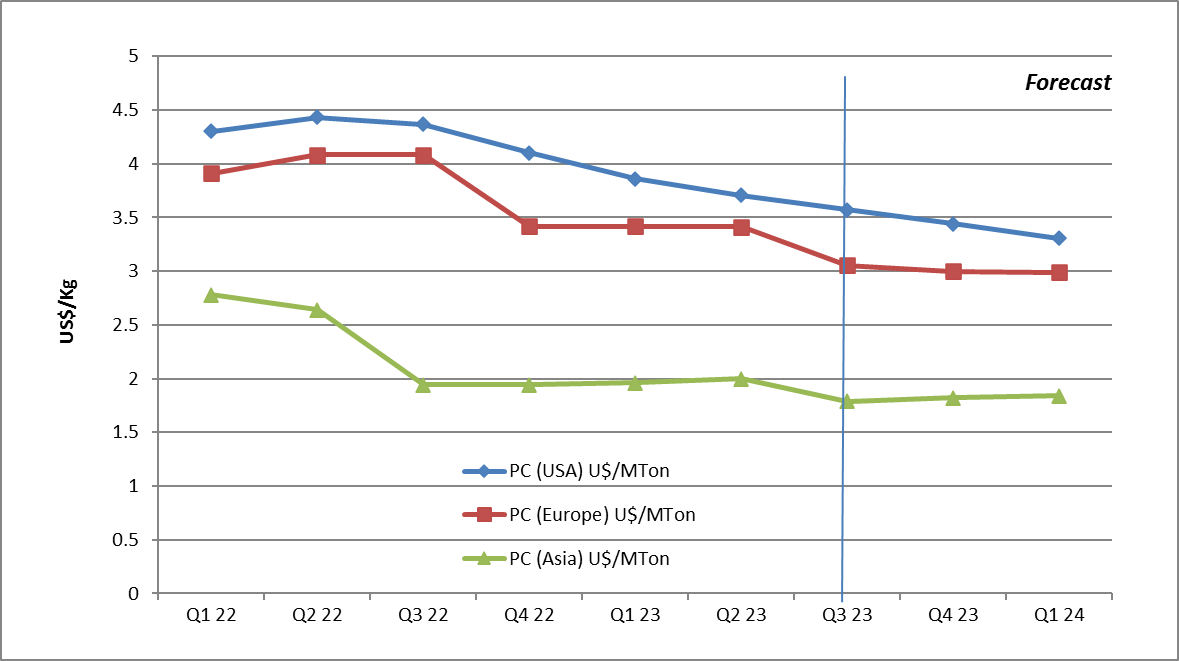
- Polycarbonate
- In EU and Asia, PC prices are forecast to be stable until the end of the year. While in North America, prices are forecasted to decline due to weakening market. Demand could weaken further if the U.S. economy slips into recession – with shrinking US GDP (according to forecasts by Oxford Economics).
- Overall global PC capacity exceeded demand. China’s PC capacity is rising from 1.6 millions tons in 2020 to 3.9 million tons in 2025, while China’s PC consumption rises only marginally, from 2.3 million tons to 2.7 million tons in 2023. All PC producers will experience declining exports to China.
- The European market is open to imports from Asia. Asia-Europe freight rates keep reducing. Recently, a 40” container has cost in the range of USD 1500 to 2000. Due to the low PC prices in Asia, the price arbitrage window is open and continues to be an attractive option for European buyers.
- Polyamide
- Nylon 6 and 66 supply remains reliable globally, with no domestic supply shortages. Prices continue to soften amidst lackluster demand. Only the automotive and new energy industries, (i.e., wind power and solar power) remained strong.
- Glass fibers seem to be much more available than before and at lower prices, while flame retardants are still short.
- Acetal
- Prices of copolymers and homopolymers are stable, globally with strong supply from Asia.
- PP
- In North America and the EU demand remains sluggish. Prices are expected to be lower with feedstock pricing trending downwards. Supply is abundant.
- In Asia, pricing is stable. Some homopolymer-grade pricing fell as inventories improved. PP copolymer prices increased slightly due to strong demand from the automotive sector.
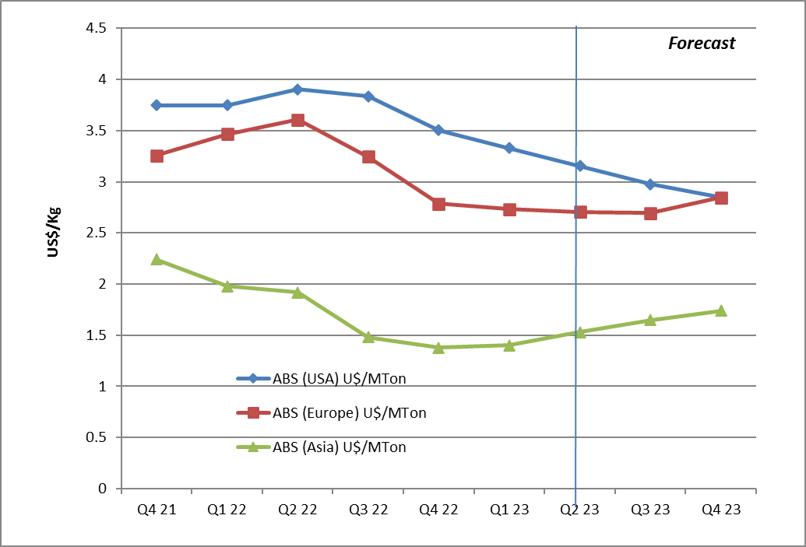
- ABS
- In North America, ABS prices are declining, driven by a combination of reducing feedstock costs and weak sales.
- In the EU, ABS demand is moderate to weak, due to high inflation, high costs, and low consumer confidence.
- Only the automotive sector is showing a positive trend while other sectors, namely building construction and appliances, demonstrated disappointing results.
- Average ABS prices showed a rollover (or a slight decrease) as compared to the previous quarter.
- China’s official purchasing managers’ index (PMI) for manufacturing turned negative in May.
- The index declined to 49.2 in May from 51.9 in April. Meanwhile, the non-official PMI, came in at 49.5 in May, down from 50.0 in the previous month.
- The Asian ABS market is under tremendous selling pressure due to the plight of weakening demand against a glut of new capacities in China.
Regional Resin Forecasts
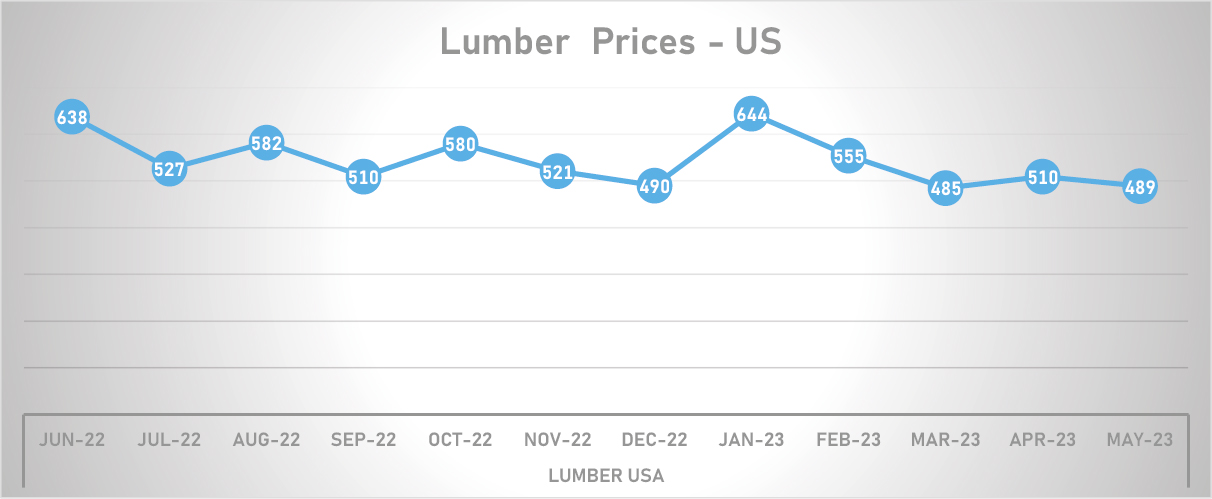
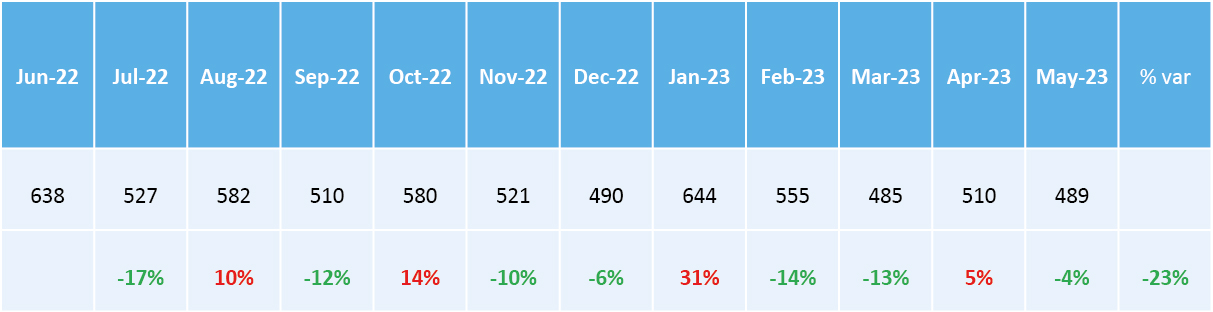
PACKAGING
- No supply issues were reported at any location. Lead times in some areas are much better.
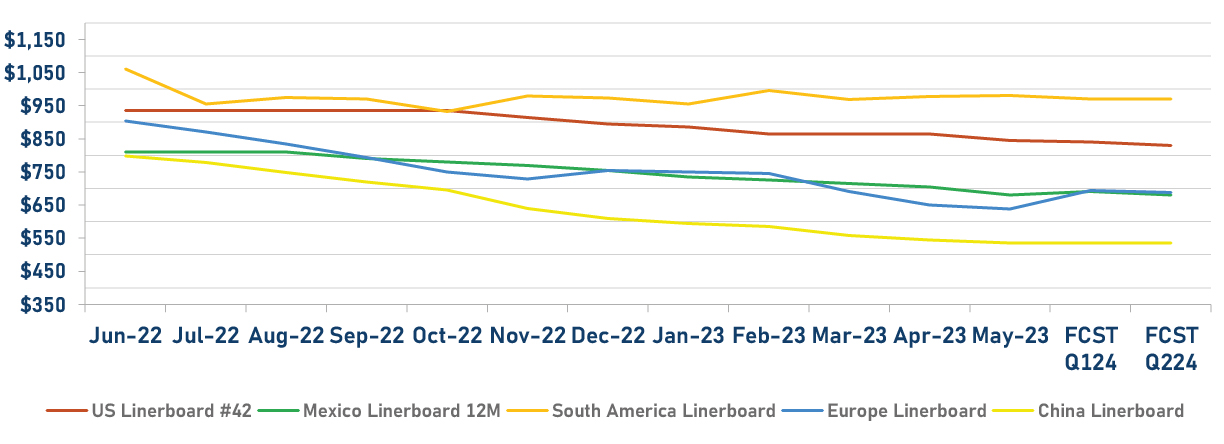
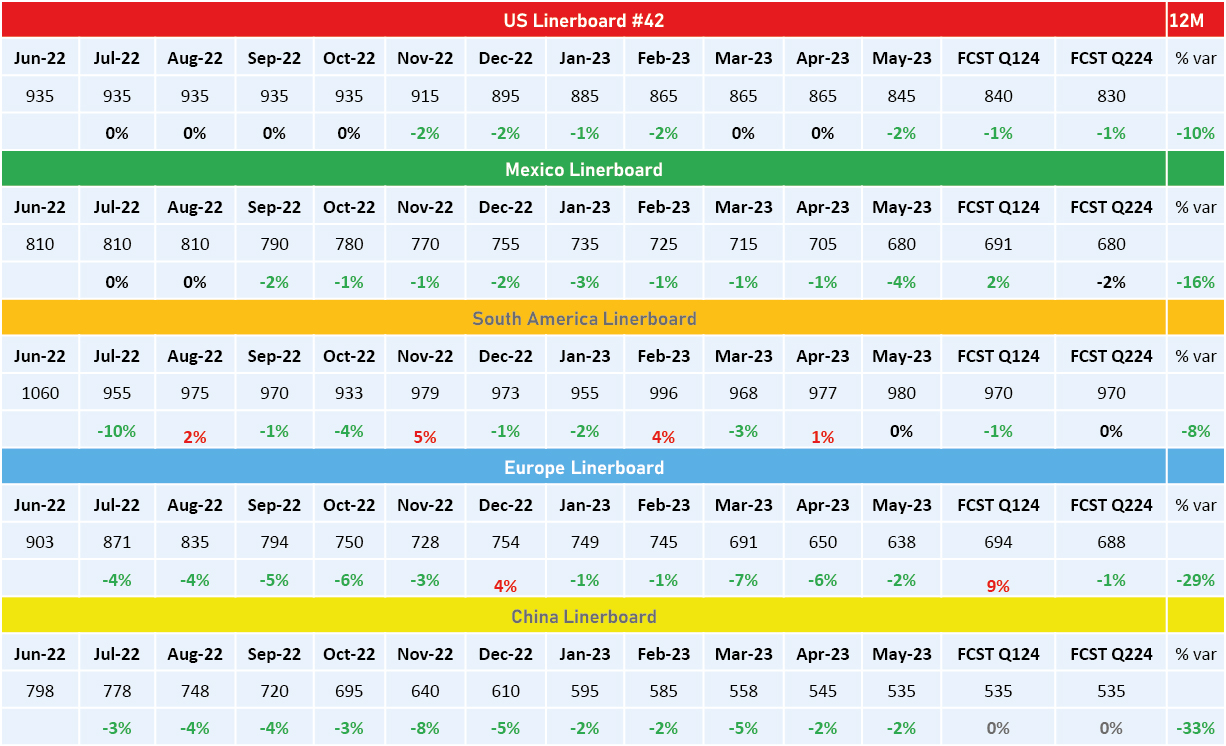
- In Q1 2023, US containerboard mills ran at 85.7% – down from 94.0% in the first quarter of 2022. Mills dramatically reduced production, by 1.1 million tons on average per quarter in each of the last three quarters. As box demand declined, they took the downtime to try to match their supply to demand and reduce the risk of lowering liner board and box prices.
- Since October 2022, the 42-lb kraft liner board has declined USD 90/ton on the open market in North America. This downturn occurred after prices raced up by USD 220/ton from four increases in the 17 months from November 2020 through March 2022.
- Various factors caused the declines this month, with the main factors being slow and mild corrugated box demand overall; a desire for orders by liner board producers and more importantly not losing orders; and a further competitive edge in the market, related to oncoming capacity startup tonnage.
- Most paper companies extended their maintenance outages during the first quarter to better adjust production to demand and avoid price decreases for their products. This resulted in operating rates for the industry being pushed down to low levels. Due to downtime, most mills’ costs increased in the quarter, putting pressure on their margins.
- As not many suppliers are willing to reduce prices, benchmarking exercises should be initiated for corrugated products in order to find the best cost-reduction opportunities and take advantage of the current situation.
- US liner board prices declined again in North America on the open market, with levels falling by $20/ton and $30/ton for virgin and recycled liner board, and by $40/ton for semi-chemical corrugating medium.
- US unbleached kraft liner board export prices also declined across all four key global markets.
PACKAGING ASIA
- The packaging market will remain in a state of oversupply in 2023 due to ongoing increases in capacity, rising competitiveness of imports, and weak demand.
- Demand will improve over the second half of the year.
- Oversupply will limit opportunities for a substantial price recovery for packaging grades, and we foresee further declines for the woodfree grades.
- The recovery in the paper and board markets seems to be taking a bit longer than expected, prompting a slightly more pessimistic outlook regarding second-quarter performance.
- We continue to anticipate demand will improve over the second half of the year.
- We expect to see price declines for most grades in the near term.
- Recycled containerboard prices grew an average of RMB 50-200 per ton, while the containerboard markets marginally improved, due to the recovering economy and producers continuing to take downtime.
- Kraftliner prices remained flat with decreasing supply.
SOLDER
- Solder markets continue growing as expected in the last quarter. The EV market continues to grow fast, especially within China and the US.
- Solder paste technologies are taking over the spend of the regular solder bar applications, due to higher volumes of new complex boards requiring smaller but powerful components.
- Solder types 4.5, 5 as well as 6 are becoming more common. These types are primarily used in 5G devices, EVs, and other high-tech industries.
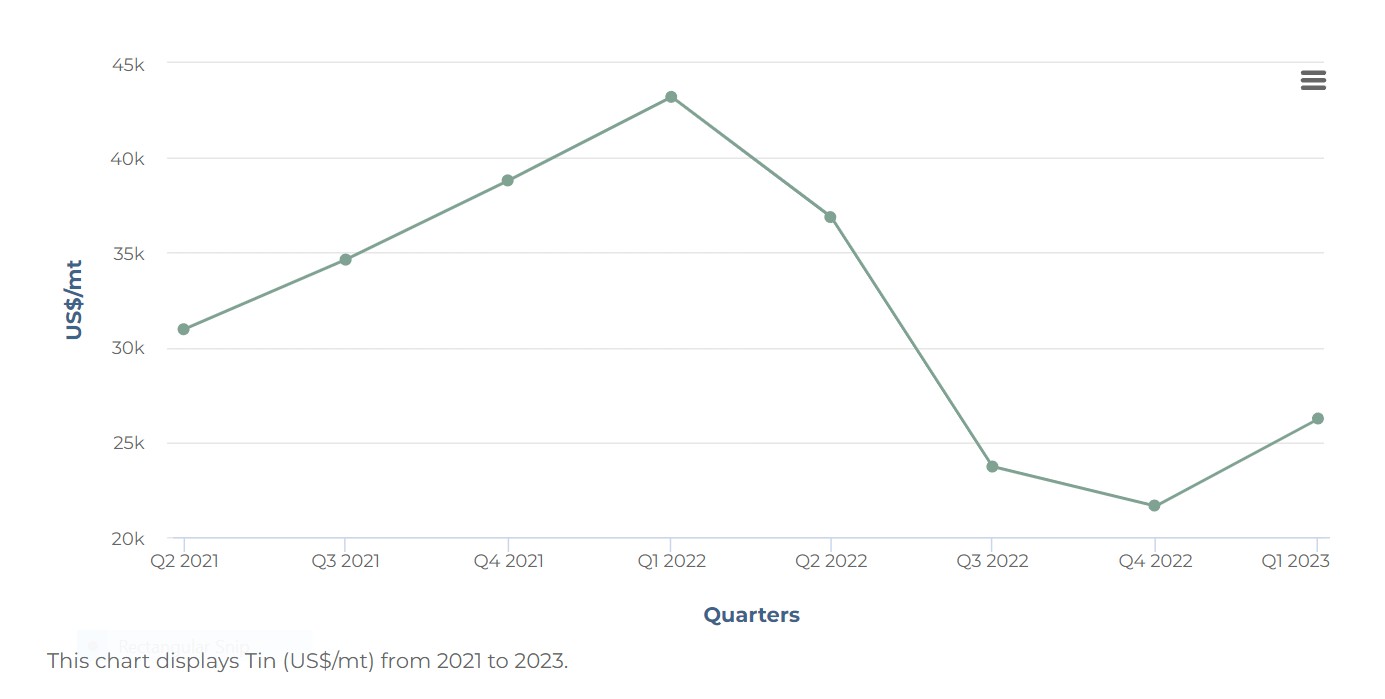
- Solder bar prices continue to be driven by the cost of the metals. Tin and silver have been volatile but continue on a path toward stabilization.
- Demand in China is recovering from COVID lockdowns and other tight measures put in place over the last couple of years. The Chinese market has returned to higher consumption levels, both domestically and internationally. Experts expect impacts to follow in global prices and inflation once the demand recovers completely.
- Tin prices have increased due to the Myanmar militia’s announcement of suspending mining activities. Myanmar is one of the top three tin producers in the world.
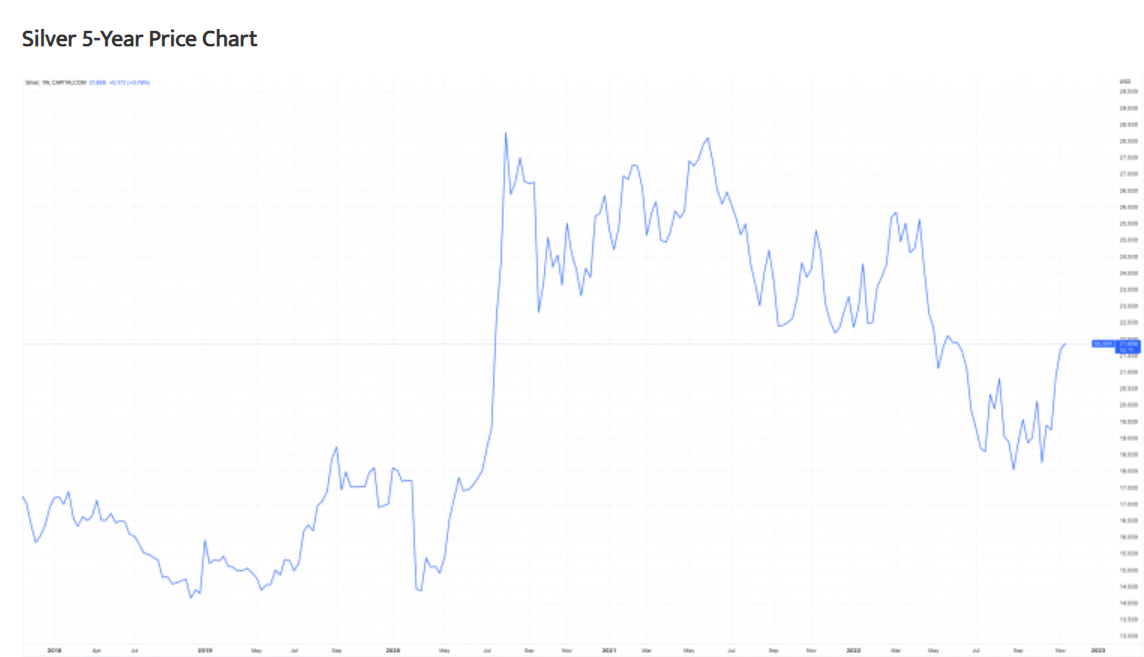
- Silver continues in a price increase trend based on the fears of a recession in the US in 2024.
- The demand for solder continues with good expectations as stated in past reports. The global market accounted for USD 1,477.2 million in 2019 and is expected to grow at a CAGR of 4.0% from 2020 - 2030, to account for USD 2,255.3 million by 2030.
- Rising demand for various smart electronics and the advent of energy-efficient electronics are the major factors expected to drive the growth of the solder materials market.
- Additionally, the rising production of electronic devices or gadgets in developing countries coupled with the presence of a notable electronics aftermarket industry is expected to boost the demand for solder materials during the forecast period.
- Conventional micrometer solder materials in the paste exhibit several shortcomings, such as high melting temperatures, which may result in undesired stress during the reflow processing, restricted applications, and defects in the joint.
- This has further led to the introduction of innovative sub-micron and nonparticipating solder materials.
- Increasing demand is also being catalyzed by the importance of smartphones, tablets, laptops, and the growing trend of Internet of Things (IoT) applications.
- The biggest consumption alloy continues to be SAC305—principally in the new technologies for which the customer relies on the secure solderability offered by silver alloys.
- Automotive and EV markets continue as key contributors to the growth in the demand of the solder industry.
- Recently announced plans for zero-emission target vehicles by 2050 are having an accelerating impact on all aspects of the supply chain and all the related industries.
- De-carbonization challenges being undertaken by most leading nations, supported by various policies and incentives, are accelerating global EV sales in 2023.
- In just the first quarter of the year. 2.3 million EVs have been sold which is 25% more than the same period in 2022.
- With current predictions of 14 million in sales by the end of 2023, EVs could account for 18% of total car sales this year.
- 5G technology is growing across different regions. This accelerated growth has increased the consumption of the solder paste types 4.5 and 5.
- The silver demand at present would be affected as well by the new technologies such as the 5G. Even as its deployment is still in its early stages, 5G-related silver demand currently constitutes approximately 7.5 million ounces (Moz).
- With the rollout of 5G in the coming years, however, silver’s role in the electronic applications used in 5G is forecast to rise significantly to approximately 16 Moz by 2025 and as much as 23 Moz by 2030, which would represent a 206% increase over today.
- For comparison purposes, in 2010, silver’s use in the once-emerging photovoltaic industry was approximately 40 Moz, and by 2018 it stood at 80.5 Moz.
- The report discusses the differences between 5G and the previous generation of digital cellular networks. It also examines the five significant technologies that make up the core of 5G technology, and the role silver will play in these technologies.
- Finally, it looks at the hardware needs and supply chain requirements, given the massive amount of financial capital required in the development and expansion of 5G networks.
- Solder Bar
- Solder suppliers are focusing their organizations on new technologies as an alternative strategy for increasing profits in a very competitive market.
- Solder bar margins are quite low, and the cost structure of the metal is principally the cost of the metals —a factor out of the control of the suppliers and the buyers.
- This along with the pressure from the markets to continue reducing prices has forced suppliers to offer other alloy alternatives for their applications.
- Solder Paste
- Continues to be one of the most important businesses for solder suppliers. The supply of this chemical is very stable, and the customer can enjoy a wide variety of brands and alloys. However, customers have been very conservative regarding testing new brands or products.
- Traditionally, solder is the powder metal and the flux, which is basically the secret formula for each company. Suppliers are relying on their R&D efforts to help ensure the ongoing success of the solder paste in all the different requirements of the industry.
- Solder types are becoming more specialized. Demand for the new technologies over the past 5 years—specifically, the use of solder types 4 to 6—has increased due to increasing requirements driven by micro components.
- Supply of solder in the market continues to be stable and no major threats are expected in the short term, however, the recovery of demand from post-lockdown China is stressing the supply chain.
- Tin supply remains relatively stable; however, the metal is very sensitive to specific geopolitical factors potentially impacting countries where tin is produced.
- One notable recent example is the threats from the United Wa State Army to suspend Myanmar mining operations from 1st August 2023. The ITA estimates this would represent about 10% of the world's tin concentrate supply.
- The threats have created an inflationary effect on pricing. Even as this development’s initial stresses on the market may subside, it is a reminder of how production of this metal could be affected at any moment—and in turn, greatly impact to the solder supply.
- Tin prices rose over the last month due to supply woes. Prices averaged USD 25,644 per metric ton in April, which was up 6.9% from March’s price but was 40.4% lower than in the same month last year.
- On 28 April, tin traded at USD 26,398 per metric ton, which was 1.8% higher than on the same day of the previous month.
- Prices increased in recent weeks chiefly due to supply concerns in Myanmar. In mid-April, the United Wa State Army—Myanmar’s largest ethnic armed organization—stated that from August onwards mining operations in Wa State would be suspended.
- Prices spiked immediately after the announcement, given that Myanmar is the third-largest producer worldwide and accounts for over three-quarters of tin imports in China—the top consumer.
- The need to preemptively stock up likely boosted Chinese demand, despite that country’s manufacturing PMI swinging into contraction in April.
- Silver
- While gold price has also dropped significantly in the last two weeks, silver is leading the latest drop in commodity prices.
- In fact, copper and zinc have also shown negative price action during this time. There are multiple factors behind this drop in silver price per ounce, but the biggest impact is due to the slower-than-expected recovery in China.
- Therefore, the silver price prediction of USD 23.04 appears to be quite valid, considering the momentum behind the ongoing downward push. To avoid this bearish outlook, silver needs to reclaim the USD 24.6 level.
- However, looking out longer term, bullish cases for both silver and gold can be inferred. The next month’s FOMC meeting will play a key role in these commodity prices.
- Physical silver demand climbed to a record high in 2021, led by an all-time high in industrial applications. Silver is the best conductor of electricity, so is often used in high-end applications.
- Consumption rose by 9% to 508.2 million ounces, according to the Silver Institute.
- There were several trends driving up silver demand, including strong consumer electronics demand amid the transition to remote working, investment in 5G infrastructure, and rising silver use in the green economy, especially in solar photovoltaic (PV) panels.
- Physical demand is expected to continue to rise.
- Sales of silver coins and bars for investment jumped by 36% to 278.7 million ounces, the highest level since 2015, “as retail investors in North America and Europe, motivated by safe-haven and inflationary concerns, took advantage of periodically lower silver prices to purchase coins and bars,” as reported by the Silver Institute.
- The market saw its first deficit since 2015, with a shortage of 51.8 million ounces, the biggest shortage since 2010.
- In 2022, silver traded up from $22.30 per ounce in late January to USD 26.90 per ounce in early March, (the peak for silver in 2022,) as the market responded to the Russian invasion of Ukraine.
- But while the market traded between USD 24 to 26 until mid-April, it began to sell off sharply later in the month as the dollar strengthened.
- In general, solder is showing a little peak from the past quarter.
- The price of the alloys will continue in a slow but sustained increasing trend as the demand continues its recovery from COVID.
- However, it is important to watch closely the behavior of the metals and the geopolitical factors of the regions where they are produced.
- In March 2023, AIM Solder, a leading global manufacturer of solder assembly materials for the electronics industry, announced the release of its newest halogen-free no clean solder paste, H10. H10 offers exceptional fine feature printing, improved electrochemical reliability, and powerful wetting.
- In 2021, electronics manufacturing services provider Foxconn Technology Group and semiconductor company MediaTek announced a collaboration to develop new 5G solutions for smart manufacturing and Industry 4.0 applications.
- This collaboration could lead to new advancements in the soldering electronics industry.
- North America is estimated as the second most dominant region in the global soldering in the electronics assembly market in 2023 just beside China.
- The combined US, Mexico, and Canada have a presence of several electronics manufacturers, such as Apple Inc, Intel Corporation, Plexus Corp., and Creation Technologies LP.
- These companies are consistently focused on the development of new and technologically advanced electronic products, which is significantly increasing the demand for soldering in electronics assembly, thereby contributing to the soldering in electronics assembly market growth.
- Moreover, soldering in electronics assembly market players in North America are Lucas-Milhaupt Inc, S-Bond Technologies LLC, Fusion Inc, Indium Corp, and Superior Flux & Manufacturing Co., among others.
- These companies are involved in the development of advanced soldering products, which is contributing to the soldering in electronics assembly market growth.
Back to Top