

By clicking the “I Accept” button, or by accessing, participating, or submitting any information, or using the Jabil Global Intelligence Portal or any of its associated software, you warrant that you are duly authorized to accept the Global Intelligence Portal Terms and Conditions on behalf of your Company, intending to be legally bound hereby, and your company shall be bound by the terms and provisions of the Global Intelligence Portal Terms and Conditions, accessible under the following link Portal T&Cs.
Jabil's Global Commodity Intelligence Archive
Global Commodity Intelligence
Q3 2024 | JULY - SEPTEMBER
Jabil's Global Commodity Intelligence Archive
Global Commodity Intelligence
Q3 2024 | JULY - SEPTEMBER

INTERCONNECT COMMODITIES
CONNECTORS
MARKET OVERVIEW
Inventory Reduction and Market Outlook
- There are signs of inventory reduction, with the average book-to-bill ratio stabilizing.
- Most manufacturers operate below 80% capacity, with a book-to-bill ratio of around 1.03:1.
- Replenishment activities are observed due to indications of reduced channel inventory.
- The demand outlook for 2024 remains subdued, leading to adjusted expectations and anticipation of market recovery in 2025.
- Suppliers aggressively pursue additional business opportunities to capture previously unawarded market share.
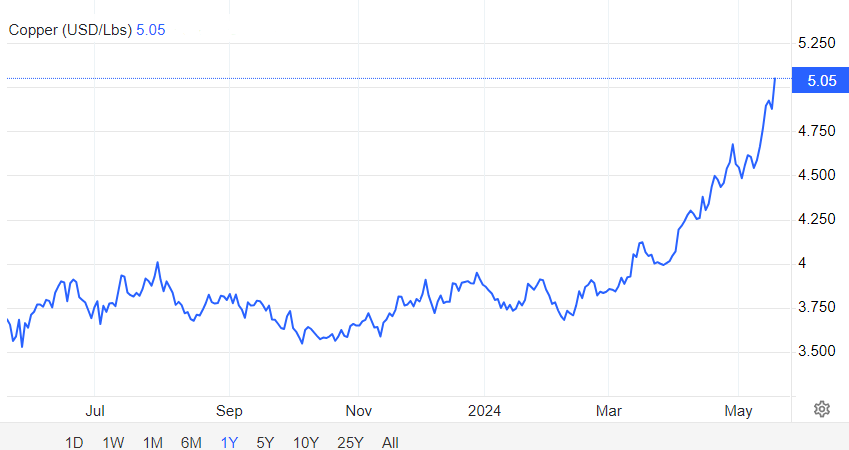
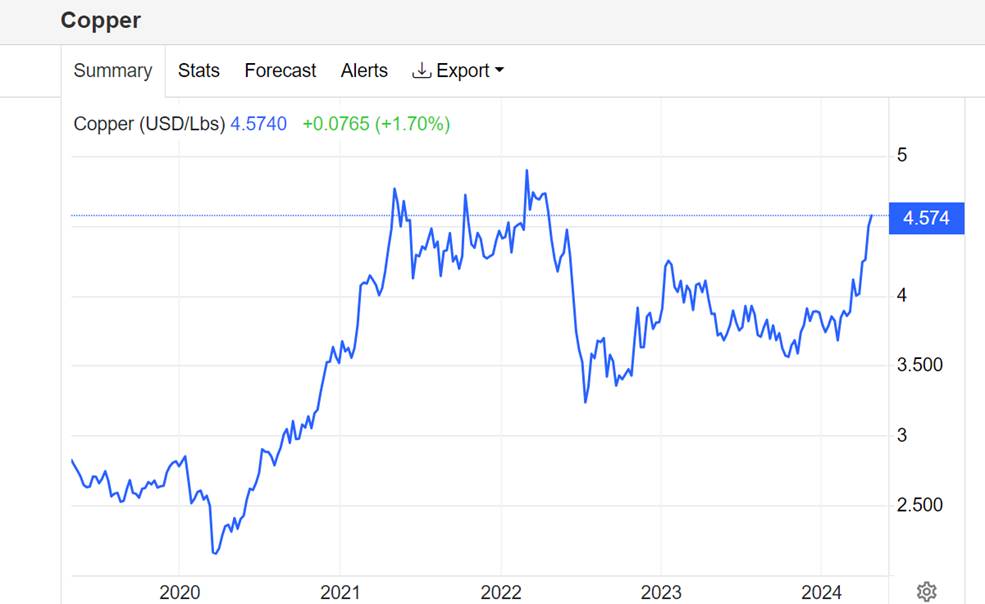
Surge in Copper Prices
- Copper prices have surged to an all-time high due to the closure of the Panama mine and capacity cuts by China's smelters.
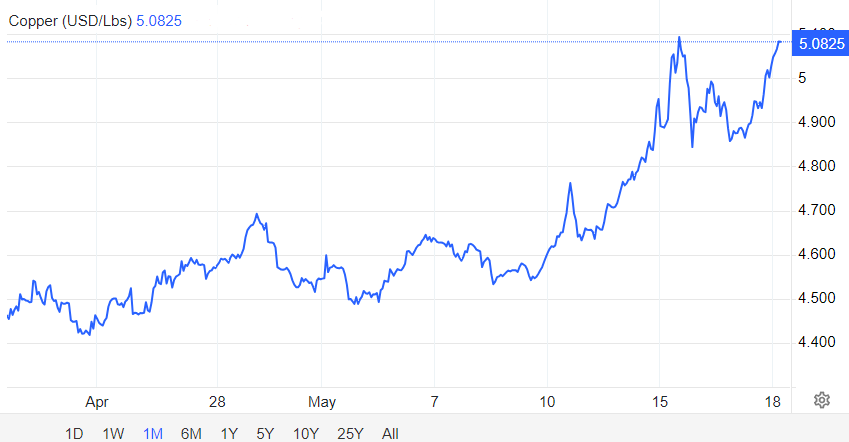
- China's smelters, responsible for processing half of the world's mined copper, have agreed to capacity reductions, particularly targeting unprofitable plants.
- The new price peak of USD 11K per ton surpasses previous peaks observed during the COVID period.
- Connector suppliers are directly impacted as copper accounts for over 40% of connector materials costs.
- China, the largest consumer of copper, has shown a negative reaction to the surge, doubting an associated increase in demand.
- Many connector manufacturers are cautious about adjusting prices, opting to wait and confirm the sustainability of the price surge.
SUPPLY
- Suppliers' factories are operating at 70 to 80% capacity utilization.
- Key suppliers' book-to-bill ratio is improving, averaging around 1.0-1.03:1.
- Lead times for connectors remain stable, with no supply constraints from key raw materials like metals and resins.
- Recent earthquakes in Taiwan did not impact the connector supply or the supplier base.
- Excess supply chain inventory shows signs of recovery, prompting suppliers to resume production to build stocks.
- Demand across market segments in the second half of 2024 appears soft, except for growth in the AI, electric vehicles, and medical sectors.
MARKET DYNAMICS
- Forward looking markets trend outlook :
- Automotive: Electric vehicle demand remains sluggish in 2024, but electrification trends continue to drive growth in this segment.
- Industrial: Overall demand in the industrial segment is soft for 2024 as customers adjust their demand and supply chain channels to deplete inventory.
- Telecommunications (5G, Cloud, Wireless Network): AI demand is the key growth driver in this segment through 2024 and into 2025, with increasing demand from hyperscale and cloud customers accelerating their investments in AI-focused systems.
- Consumer: Overall demand in the consumer market will remain soft through 2024, although suppliers expect the usual seasonality adjustment.
- Medical: Growth is expected in the medical segment, particularly from equipment for interventional procedures.
- Aerospace and Defense: Military and defense applications continue to show strong demand, primarily due to conflicts worldwide.
- The supply base remains stable, with no indications of suppliers exiting the market.
- Amphenol Corporation recently announced a definitive agreement to acquire the Carlisle Interconnect Technologies (CIT) business for USD 2.025 billion in cash.
- CIT is a leading global supplier of harsh environment interconnect solutions, primarily to the commercial air, defense, and industrial end markets. It boasts approximately 6,000 talented employees worldwide.
- CIT's wide range of products, including wire and cable, cable assemblies, contacts, connectors, and sensors, complement Amphenol’s existing interconnect and sensor solutions.
- CIT will have approximately USD 900 million in annual sales in 2024.
- TE Connectivity settled its public tender offer for all publicly held shares of Schaffner Holding in December 2023. This acquisition will be reported under the TE Industrial segment.
PRICE
- Connector pricing for PCB Connector Type, commonly used across market segments, has decreased in 2024 and is expected to continue declining until the year-end.
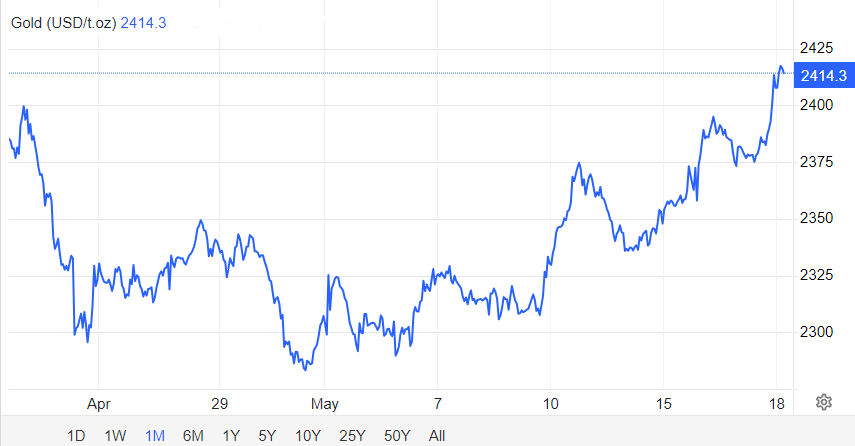
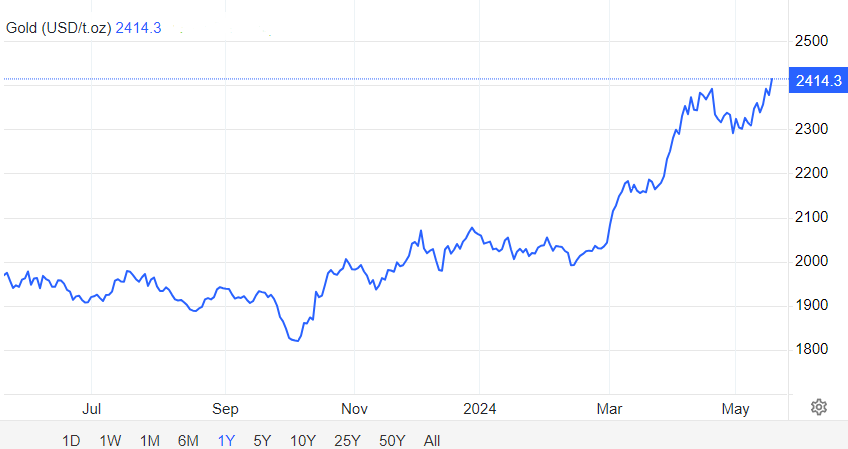
- Gold and copper prices continue to rise, but key connector suppliers have maintained pricing without increases in Q3 2024. Monitoring of raw material prices is necessary.
- Suppliers are still affected by rising energy and labor costs and general inflationary concerns.
- Most suppliers are open to reviewing pricing for new business opportunities and gaining a share of existing business.
- Some price increases are observed on low-margin and legacy products like Headers & Receptacles, D-Sub, Non-High Speed I/O (USD2.0), and labor-intensive RJ45 Magjacks.
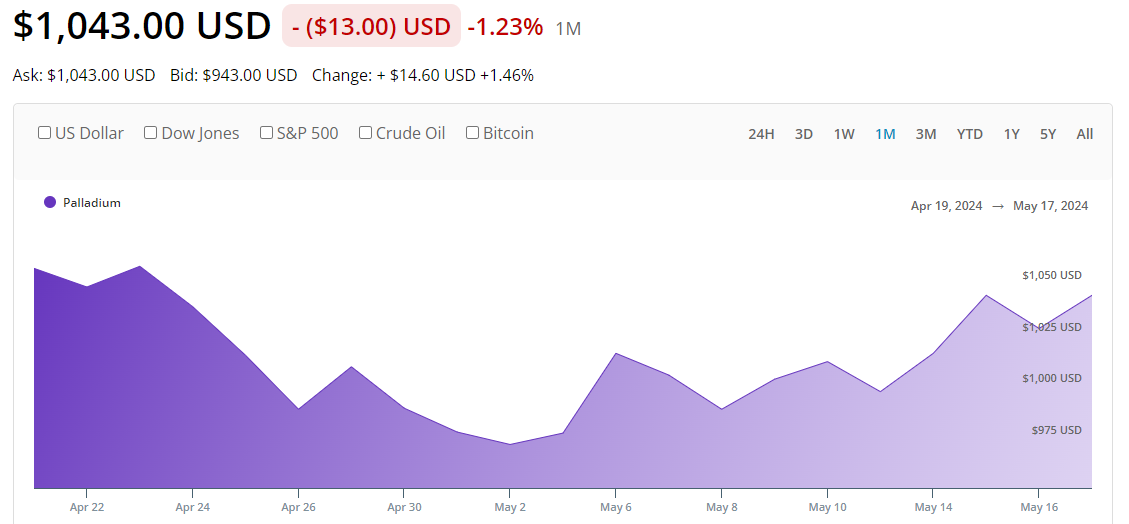
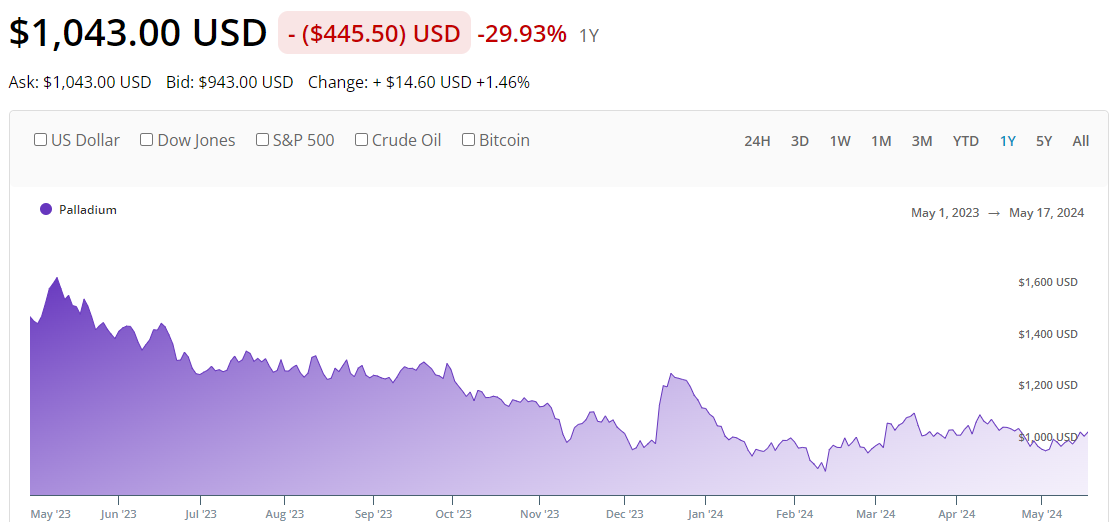
GOLD, COPPER & PALLADIUM
MONTH vs ANNUAL
 |
 |
|
 |
 |
 |
Relay
SUPPLY
- The book-to-bill ratio remains below 1, indicating a continued gap between orders received and fulfilled. Notably, production lines catering to electric vehicles and renewable energy face capacity constraints and operate below their full potential. Additionally, traditional relay production lines are undergoing downsizing.
- Anticipate a significant customer pull-in as end customers adopt a conservative approach, while relay capacity remains relatively inflexible. Adjusting production capacity for standard relay lines and achieving stabilization typically takes six months and one year.
MARKET DYNAMICS
- The market is uncertain, primarily due to geopolitical tensions and China's underperforming market. Recent military conflicts in the Middle East have further exacerbated the situation.
- Tier 1 relay manufacturers are focusing on high-power DC relays to capitalize on the growing electric vehicles and renewable energy markets.
- Signal relay demand is recovering, whereas the demand for power relays is declining.
- Copper prices are expected to surge over the next two years due to mining disruptions and increased demand driven by the green energy transition. Chinese smelters, processing half of the world's mined copper, have agreed on production cuts, further impacting prices.
PRICE
- Prices for standard relays are expected to remain stable, but the costs of raw materials, labor, energy, and transportation continue to fluctuate. Copper prices are approaching peak levels, impacting manufacturing costs. Suppliers such as HongFa, Omron, Panasonic, and FCI/Fujitsu strive to maintain current pricing.
- Prices of solid-state and specialty relays may fluctuate due to China's export restrictions on semiconductor raw materials like gallium and germanium.
- Manufacturers of industrial relays and contactors, including Eaton, ABB, and Schneider, persist with average annual price increases of approximately 5% to 7%.
SWITCH
SUPPLY
- Lead times have remained consistent, indicating no capacity or raw material availability issues, although there may be limitations concerning copper. Switch suppliers have proactively expanded their production capacities in 2022, contributing to supply chain stability.
- The book-to-bill ratio remains below 1, but C&K and CTS are experiencing increased volume, particularly in the computing sector, driven by AI-related business.
- Most switch manufacturers operate their factories at around 70% utilization, while China-based manufacturers have increased capacity to nearly 90%, typically not maintaining inventory as part of their standard practices.
MARKET DYNAMICS
- The switch market is evolving, replacing traditional switches with touch panels and other sensing components.
- Slow and steady growth is observed in China and ASEAN's consumer markets, while markets outside these regions face uncertainty.
- Panasonic’s headquarters relocation from Osaka to Tokyo aims to access Japan's talent pool.
- Rising copper costs pose challenges in pricing and potential supply issues. BloombergNEF analysis suggests a 20% surge in copper prices by 2027, exacerbating supply-demand mismatches.
PRICE
- Overall pricing has remained stable despite challenges, as manufacturers strive to sustain it. Copper prices are reaching all-time highs, compounded by rising energy costs, labor expenses, and inflation.
- Specialized industrial switches from companies like Eaton, ABB, and Schneider are expected to undergo price increases ranging from 5% to 7%, further exacerbated by the spike in copper prices.
Back to Top